Explore the complete guide to embedded analytics, including architecture, security, AI capabilities, implementation patterns, and evaluation criteria for modern applications.
White-Label Software and Analytics: Enhancing Your Brand
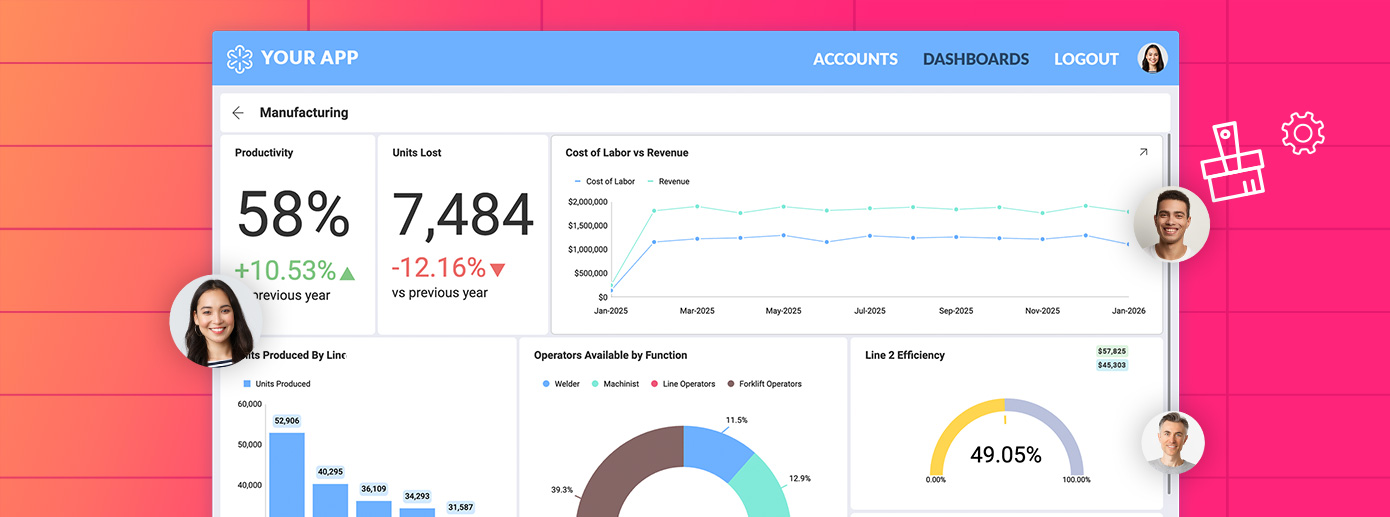
Fully branded white label dashboards offer custom personalization so that your customers can present a holistic service that is all branded to one company.
Adding embedded analytics to your software comes with tremendous opportunities to expand your business, add value for your customers, increase productivity, and ultimately drive revenue growth. In today’s data-driven and highly competitive business environment, embedded analytics is no longer ‘’nice to have’’, but a definite ‘’must-have’’ solution.
This Product Fit Guide was designed to help walk you through the most important steps involved in finding an embedded analytics vendor that fits your needs. Before continuing, take a moment to think about your specific needs and requirements. Write them down on a piece of paper and then compare them during your research.
By the time you finish reading this whitepaper, you’ll have a solid understanding of all the things you need to consider when adding embedded analytics into your software, and maybe you’ll have found your perfect match.
Continue Reading
Fill out the form to continue reading.
Form submitted
Data Sources & Visualizations
Among the first things you should consider when choosing an embedded analytics vendor are the data sources available. Data is what drives your visualizations, and you need to be able to connect to it no matter where it lives.
Once you have your data, different visualizations will help you tell your story. Data visualizations are the different chart types used to present your data in a way that makes it easier for you and your consumers to understand and gain insights. Using data visualizations such as charts, graphs, maps, and other visual elements can help make data more accessible to an entire organization and, at the same time, support and guide the decision-making process.
Here are the most important factors to take into consideration regarding data sources and visualizations:
Supported Data Sources
A good embedded analytics vendor supports a wide range of data sources that users can bring together into one view or location for a more comprehensive analysis. To be able to do that and see the complete picture, your analytics solution needs to connect to your data regardless of where it is stored – on-premises databases, analytics tools, content managers, cloud services, CRMs, spreadsheets, or public data sources.
Note that much of the data that’s being generated by businesses today is unstructured data. Many analytics platforms can’t work with it and analyze that data.
When connecting to a data source, all your data on the server is loaded and downloaded locally, so you have your data set ready to be processed, sorted, filtered, aggregated, and used for visualizations.
Data Visualization
A spreadsheet with hundreds of rows of numbers can seem terrifying to someone not trained in data analytics. But if that person takes a look at a bar chart, map, or graph, they will immediately gain insights from those numbers. Data visualization refers to a range of chart types that the embedded analytics vendor provides to its users. You need to be able to choose from a library of rich charts such as column, line, or combo to more advanced ones such as treemap or geospatial mapping. Moreover, users need to have the opportunity to bring all these visualizations into one view regardless of the source to create one comprehensive and beautiful dashboard.
Supported Visualizations
When choosing an embedded analytics vendor, make sure that the system supports the following data visualization types:
Business Charts – Today’s most popular chart types include chart types such as – column, bar, pie, line, and much more. These charts allow users to see the results of data to better understand and predict current and future data. For example, a line chart can tell the overall story of data trends over time faster than a narrative or numbers, and a bar chart can let the viewer quickly compare counts or performance among different categories.
Gauges – These chart types are meant for best showing a single data value within a quantitative context and include bullet graphs, KPIs, linear, circular, and single value gauges. These charts are great for indicating whether a metric goes above or below a specific range.
Grids – When you want to accompany your visuals with a more specific look at the data behind them, tables are typically the best way to display that information. That’s partly because everyone knows how to read tables’ column and row structure. You might include tables in your data visualization reports when you know stakeholders will want to see more granular information.
Maps – The map type data visualization is used to analyze and display geographically related data. It presents users with the visual distribution of data in different regions and helps them gain a deeper understanding of geographical information and make better decisions.
Data visualization can help you identify trends and patterns, understand complex information quickly and easily, communicate a story, analyze risk, address issues, and more. But there are data visualization types that are great for one use case and, at the same time, terrible for another. Understanding the different data visualization types will help you best visualize your data and extract actionable insights from it.
Custom Visualizations
Having these types of data visualization available is definitely something that you should be looking for, but sometimes although they can work for many various use cases, your specific business need might be unique. For that reason, it’s important to have the ability to create your own custom visualizations.
Product Features
The primary advantage of embedded analytics software is its features and functionalities, and the best vendors provide a lot more than just data visualizations. The product features are basically what will help you position your business above the competition and increase your revenue. With this in mind, you should pay close attention to what features a given embedded analytics solution includes and whether they are the functionalities you need to grow your business.
Dashboard linking is a feature that allows you to link one visualization or dashboard to another dashboard or a URL. This takes drilling down and digging deeper into insights to a new level. For example, if you are looking at a high-level dashboard around your sales numbers, you might want to dig deeper into revenue in a specific region. You can link your high-level dashboard to a more detailed view that will pass through the region parameters you clicked on. This can be especially useful in Company 360 dashboards, where you will be able to establish top-down analysis paths, where you go from a high-level overview of the reality of a business to more detailed views with the specifics.
Custom Themes
A seamless, personalized experience is the key to customer loyalty. You can personalize all stages of the customer journey, including the look and feel of your product. You know for how long psychologists have been saying how important the first impression is. Well, your users’ first impression of your product is the look of it. Consistent branding will keep them more engaged and more loyal to your brand.
Invest in a solution that will allow you to customize the visual elements, such as fonts and colors, and ultimately let you create your own custom theme from scratch.
Machine Learning & AI
As a subset of AI (artificial intelligence), machine learning enables systems to learn and predict outcomes without explicit programming and helps answer key business questions intelligently. Machine learning is often used interchangeably with the term AI because it is the AI technique that has made the greatest impact in the real world to date, and it’s what you’re most likely to use in your business.
The business results that are being driven by machine learning can dramatically affect a company’s bottom line. For example, the ability of machine learning algorithms to make data-driven decisions makes a huge difference between keeping up with the competition and falling further behind. Machine learning can be the key to unlocking profitable opportunities and keeping your company ahead of the competition.
Self-Service Features
Let’s face it; data doesn’t come easy for everyone. It’s highly likely that most of your organization is far from being data experts or scientists. And the same goes for your end-users, too. For that reason, it is extremely important to remember that all your users are different and have unique use cases for using analytics.
Self-service features are the processes and tools that empower end-users to analyze large amounts of data, build custom dashboards, and create reports independently. That means that when someone needs a specific report or dashboard, he can do it himself instead of waiting and relying on the IT team or BI experts. Of course, that leads to an increase in productivity, boost in collaboration, and frees up precious time from your IT’s so that they can focus on other important tasks.
With self-service features like drag-and-drop analytics, users will stop making gut-based decisions. In fact, they’ll do exactly the opposite – self-service BI brings effortlessness and effectiveness to the decision-making process, making the decisions better, smarter, and, most importantly, data-driven.
Modern, Flexible Architecture
Application architecture refers to the patterns and techniques used to design and build an application. The architecture gives you a roadmap, a starting point, and best practices to follow when building your application, so you can rest assured that you’ll have a well-structured and functioning app in the end.
When it comes to integrating analytics into your existing application, it is essential that the software flows seamlessly without adding additional weight and complexity. Therefore, it is important for your embedded analytics vendor to be built from the ground up with embedding in mind first. Many of today’s vendors built standalone business intelligence tools and molded them into an embedded offerings. This adds additional requirements and complications with their back-end systems and, ultimately, costly pricing models.
In addition to being purpose-built for embedded analytics, below are additional things to look for about a vendor’s architecture:
Native Desktop, Web & Cloud SDK’s
The next thing that you should be looking for is an SDK (software development kit). Integrating analytics via native SDK is better compared to integrating analytics through iframes. When embedding analytics into your application, an SDK is provided as a library or framework that is integrated into the app – or at least you need to find a vendor that offers a native embedded SDK. It is to help developers use it to integrate their apps with embedded analytics software.
The native SDK utilizes the specific features of each platform and provides a superior user experience for creating, editing, and annotating dashboards on any device.
TechStack
When looking for an embedded analytics solution, the vendor must support your tech stack – or less it is a dead end. You need a solution that will plug into your back-end technologies, such as:
The difference between cloud vs on-premises software is where this software will reside. On-premises software is installed locally on your business’s own computers and servers, whereas cloud software is hosted on a vendor’s server and accessed via a web browser.
But there are other things worth considering too when deciding between cloud vs on-premises:
Cloud Software Pros
Accessibility – Cloud-based software can be accessed anytime, anywhere, and from any device.
Affordability – You pay only for the resources that you use, and the price adjusts up or down depending on that. Maintenance and support services are typically included.
Security – Data centers apply security measures beyond the affordability of most businesses; therefore, your data is safer in the cloud than on a server in your offices.
Scalability – It’s easier to scale to meet demand, such as expanding your storage or adding back licenses.
Fast deployment – Cloud-based software is deployed on the Internet, and the deployment process usually takes not more than a couple of hours.
Cloud Software Cons
Connectivity – Cloud-based solutions require a stable and reliable Internet connection to be accessed and used.
On-Premises Software Pros
Complete control – For better or worse, in an on-premises environment, you’re in full control of what is happening. You decide on the configuration, the updates, and system changes.
Data security – This could be considered as a pro and as a con at the same time. Data security is in your own hands, and you have full control over how you secure it. For some companies, this is a huge benefit, while for others, it isn’t, as they don’t have the expertise to do it themselves.
On-Premises Software Cons
Maintenance – Unlike the cloud-based solution, where everything is handled for you, you are responsible for maintaining server hardware and software, storage, and data backups with on-premises solutions.
Implementation – On-premises implementation takes longer due to the time needed to complete installation on servers and each individual computer.
Pricing Model
Pricing is one of the most important things to consider when choosing a vendor to go with. You’ll be hard-pressed in the embedded analytics space to find clear, transparent, and publicly available pricing. Most embedded analytics vendors keep their pricing a secret and charge you unpredictable costs like usage and users. Ever wondered why? Let us explain…
Software vendors use this pricing structure technique to charge customers on a per-user or usage-based model, maximizing the product’s price while leaving ‘’no money on the table’’. This pricing structure leads to shocked faces when their invoice arrives as the price increases as they grow their business and user base.
Another tactic that some embedded analytics vendors use is to ask you for the price of your app and your company revenue streams before they give you a price. Sounds sketchy, doesn’t it? Well, that’s because it is.
By doing so, they try to figure out how much you have and come up with a pricing strategy designed to maximize their profit.
So, while looking for embedded BI software to integrate into your apps, be cautious when you recognize these sketchy pricing models. Luckily, not all embedded analytics vendors are the same, and by knowing what you look for, you’ll be able to find the best solution.
First and foremost, you want to know upfront how much the software is going to cost you. That means looking for a 100% transparent pricing model that won’t escalate as your app sales increase. Or in other words, to get fixed pricing that won’t come with any surprises, hidden fees, usage, or user tiers.
Ask the vendor these questions:
What is the total cost of the solution? Including implementation, training, support, and other fees.
Are there any undisclosed costs?
Do you have cloud usage or per-user fees?
Can the solution be deployed for local or cloud-based hosting on Windows or Linux containers?
Ultimately, the pricing should make the buy vs build decision easy and shouldn’t be the most stressful part of the evaluation. If it feels the other way around, you should look elsewhere.
Team, Roadmap & Support
Last but not least, you need to take into consideration the vendor’s team, support, and roadmap when choosing an embedded analytics vendor.
Team
Data analytics is a science that not everybody is an expert in. Whilst searching for the best embedded analytics fit for your application, make sure to find out and get to know the team behind the solution. Does the team have experience in analytics, or is this a completely new startup where everyone learns as they go? Do they really understand the needs of application providers?
Find out the answers to these questions, and you’ll clearly understand whether it’s worth investing in this solution or not.
Roadmap
Getting to know who’s behind a given solution is the first step. The next important thing you need to learn is what they plan on doing next. You need to ensure your vendor is innovating and delivering value as fast as your customers will ask for it. A roadmap is a strategic plan that defines desired outcomes. Having visibility of a vendor’s roadmap is key so you know what’s coming next and what you could benefit from soon enough. It gives you peace of mind and assurance that your vendor is working just as hard as you are to satisfy your customers.
When reviewing a vendor’s website, look for these signs:
Is a public roadmap prominently posted?
Is the roadmap up to date?
Does the vendor show success in the delivery of previous roadmap commitments?
Support
When choosing the right solution for your business, it’s important to understand that it is not just about technology; it’s also about finding high-level, quality, and experienced support that can ensure your success. A combination of live and self-service support options and experienced professionals must be available to help you with any technical questions.
But it’s not just what you should be looking for. Documentations and FAQs are fundamental and invaluable, but so are community forums. An active user community can help you share best practices and experiences with others, so anyone can benefit and help each other grow and succeed.
Check with the vendor about their customer support policy and turnaround time, how they help with implementation, and what kind of services and resources they have available.
What’s Next?
Choosing an embedded analytics vendor to partner with is not that easy, but the choice will become clear when knowing how to differentiate the pros and cons and what will work for your unique business needs.
We know that you probably have a lot more questions, and we’re always happy to answer them and help further. Get in touch with Casey McGuigan at CaseyM@revealbi.io.
Book a demo – See Reveal in action and learn how it can accelerate your business.
Talk to an expert – Book a call with our sales team and get answers to all your questions.
Key Considerations:
As businesses continue to make analytics and BI their top investment priority, choosing the right embedded analytics vendor to partner with is paramount. What features does it offer, how was it built, does it fit in your budget, and is it going to innovate and deliver value in the long term? We know you ask yourself these questions, and we’re here to help you answer them. And moreover, provide you with clear guidance on what you should be looking for before investing in an embedded BI vendor for your unique business needs and use cases.
In this Product Fit Guide, we’ll explore the following areas:
Data sources & visualization
Product features
Modern, flexible architecture
Pricing model
Team, roadmap & support
About the Author
Bilyana Petrova
Bilyana is an Embedded Analytics Content Specialist at Reveal. From research to creative writing, she's on a mission to make boring business blogs useful and actionable. When she's not at work, you can hardly find her as she loves discovering new destinations around the world, summiting mountain peaks, and playing with her adorable Siberian Laika.
Your Privacy Matters:We use our own and third-party cookies to improve your experience on our website. By continuing to use the website, we understand that you accept their use.Cookie Policy.
We use our own and third-party cookies to improve your experience on our website. They also allow us to analyze user behavior in order to constantly improve the website for you. Please review our Cookie Policy and cookie settings below.
When you visit any website, it may store or retrieve information on your browser, mostly in the form of cookies. This information might be about you, your preferences, or your device and is mostly used to make the site work as you expect it to. The information does not usually directly identify you, but can give you a more personalized web experience. Because we respect your right to privacy, you can choose not to allow some types of cookies. However, blocking some types of cookies may impact your experience of the site and the services we are able to offer.
Your Privacy Matters: We use our own and third-party cookies to improve your experience on our website. By continuing to use the website, we understand that you accept their use. Cookie Policy.