Scriptly Helps Pharmacies Identify Trends in Real Time with Reveal
Explore the complete guide to embedded analytics, including architecture, security, AI capabilities, implementation patterns, and evaluation criteria for modern applications.
Read NowFully branded white label dashboards offer custom personalization so that your customers can present a holistic service that is all branded to one company.
Read NowLearn about data blending. We cover what sets it apart, why it’s indispensable for modern business, and how it differentiates from the traditional data joining method.
Executive Summary:
Organizations are constantly looking for the best ways to get more value out of their data and improve their business decision-making, a quest that has led to the evolution of innovative techniques. One such powerful data analysis technique that has emerged as a game-changer is data blending.
The data blending technique allows organizations to derive richer insights from their data by combining multiple datasets from various sources in one visualization. By seamlessly blending together information from multiple sources, organizations are empowered with a more holistic understanding, allowing them to be more strategic with their decisions and remain competitive.
Read on to discover more about data blending. We cover what sets it apart, why it’s indispensable for modern business, and how it differentiates from the traditional data joining method.
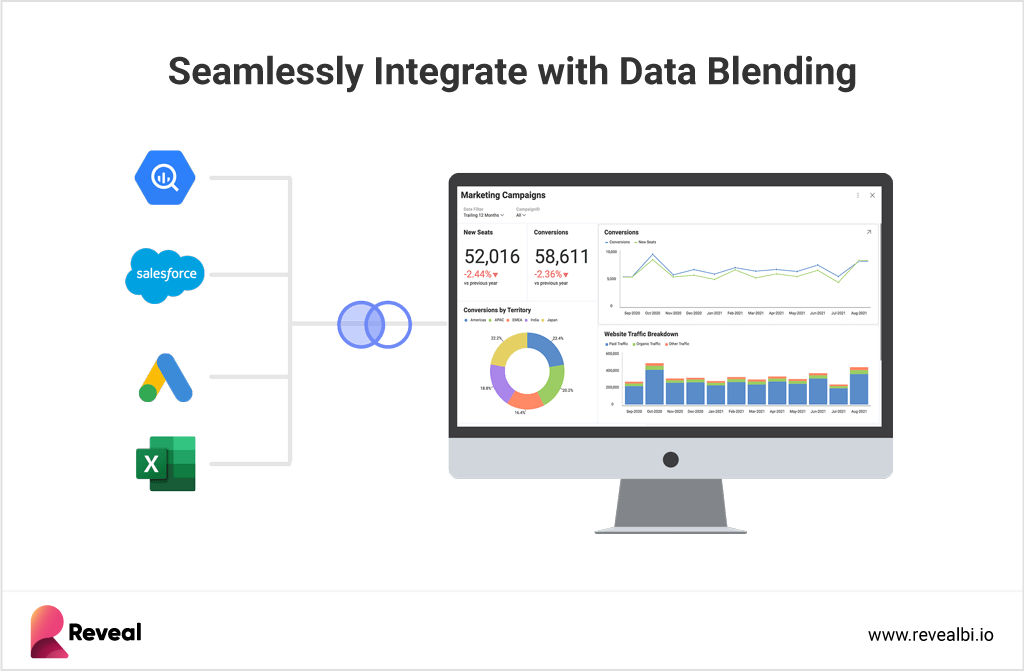
Data blending is the process of seamlessly combining information from various sources to create a comprehensive dataset for more successful business decision-making. This allows organizations to gain more valuable insights from various sources and create a deeper analysis. Unlike traditional methods involving complex joins and extensive data restructuring, data blending allows analysts to seamlessly integrate data without altering its original form.
Data blending is invaluable for gaining a holistic perspective on information. It empowers data analysts (and business users also) by enabling the seamless incorporation of diverse data types and sources into their analyses, leading to faster and deeper insights for informed decision-making. Unlike working with isolated datasets, data blending addresses limitations, allowing analysts to uncover hidden patterns, correlations, and trends that may be obscured when data is analyzed in isolation. On the other hand, combining two or more datasets broadens the spectrum of available data, providing a fresh perspective that contributes to making better business decisions. In essence, data blending acts as a catalyst, breaking down silos and enhancing the depth and accuracy of analyses, thereby unlocking the full potential of multiple datasets together.
Now that we have covered what data blending is and why it is important, let’s look at some additional benefits it brings to the data analysis process and why you should consider an embedded analytics tool with data blending as a feature.
Distinguishing between data blending and data joining is essential, as the two concepts, although similar, operate with distinct capabilities. Data joining only allows you to combine data from a single source, whereas data blending enables you to combine data from multiple sources. Joining is often restricted by the size of datasets, and not all databases support this method, especially when dealing with duplicate data.
On the other hand, data blending can combine datasets with different structures, formats, and sizes effectively. This versatility positions data blending as a powerful solution, particularly in scenarios where multiple datasets with varying structures need to be harmonized for a more holistic understanding and impactful decision-making.
Reveal is an embedded analytics solution that makes data blending and joining tables very easy, allowing you to unlock valuable insights and make data-driven decisions.
Watch our tutorial and see how easy it is to use one of the key features of our embedded analytics software-data blending- to combine multiple sources into one visualization for a deeper, side-by-side view.
Effortlessly integrate Reveal into your application to leverage its powerful data analysis capabilities, saving valuable time and resources compared to developing a custom solution that risks becoming outdated before completion. Whether you’re working with IoT devices, healthcare apps, business teams, or data-driven companies, Reveal is an ideal embedded analytics solution. The subscription grants end-users access across all native platforms, spanning iOS, Android, desktop, and web.
Reveal’s native SDKs empower a transformative user experience, allowing for the creation and editing of dashboards directly within your application. In addition to the data blending feature, Reveal also offers a plethora of other embedded analytics features, including intuitive drag-and-drop functionality for a simple dashboard creation experience, predictive analysis, dashboard linking, white labeling capability, calculated fields, statistical functions, drill-down, interactive chart filtering, and more. We also provide dashboard templates and the option to create your own custom data visualizations with just a few lines of code. With all these features and functionalities, your teams and users can quickly get equipped with the insights they need to make faster and better-informed decisions for business growth.
Learn more about Reveal’s ease of use and capabilities by scheduling a free product tour or by downloading our SDK to test the product yourself.