
Data is a crucial part of every business. Finding the value in data and presenting that value to your target audience in an understandable way requires effort. Simply presenting spreadsheets with rows of numbers is not enough to display the value of data. But when data is presented in the form of a story, it is easier for people to understand its importance and react accordingly.
And that is essentially the power of data-driven storytelling. ‘’Numbers have an important story to tell. They rely on you to give them a clear and convincing voice.’’ – says data visualization expert Stephen Few. If data isn’t understood and it isn’t convincing, no one will act on it, and therefore nothing will change.
So, the good news is that people love stories. Storytelling has always been a powerful technique to educate, explain, and influence a targeted audience or desired action.
With this in mind, let’s dive deeper into what data-driven storytelling is, the top reasons to use data-driven storytelling, how a storyboard helps in data storytelling, and go through a few data-driven storytelling examples.
What is Data-Driven Storytelling?
So, what exactly is data-driven storytelling? Simply put, data-driven storytelling is the ability to turn raw data into easy-to-read and easy-to-understand plain stories that help us turn insights into action. It is a structured approach for communicating data insights through data visualization, infographics, dashboards, and other visual elements.
We are programmed to think visually, so transforming data into a visual story is crucial for anyone who wants to leverage the value that data provides in their business.
Studies have shown that at least 75% of people are visual learners. We remember only 10% of what we read, 15% of what we hear, and 75% of what we see. We also process visuals 60,000 times faster than text and tend to focus on visual information. Furthermore, we have the unique ability to remember pictures with at least 90% accuracy.
Data-driven storytelling can influence action both within and outside of an organization. Within the organization, it could help your team better understand what matters the most and act on it. Outside of the organization, data-driven storytelling is used to motivate the desired action. A few examples of such actions are signing up for a newsletter, adding an item to your cart, and checking out or sharing content on social media.

A good data story is formed by three components:
- Data analysis
- Data visualization
- Narrative
Data analysis
The data analysis component is the basis of a good story; therefore, mastering your data is an essential part of the process. Data storytelling requires accurate and up-to-date data to derive actionable insights. This is the first step of the process; if not done correctly, it will not deliver the desired results.
Data visualization
Visualizations are a highly effective way to tell a data-driven story. They engage the audience, trigger emotions, and enhance data-driven decision-making.
Data visualization helps us spot trends and patterns that might have otherwise been missed. It also helps us convey the meaning of data in a way that is understandable, memorable, and attractive.
The insights gathered from the data are presented in the form of charts, infographics, tables, images, and other visual elements such as a treemap chart and even videos.
Narrative
The narrative component is about the simple language used to describe the data. A narrative is used to support the visualizations and insights in the simplest way possible. It highlights key KPIs metrics, and trends and expedites the decision-making process.
Top Reasons to Use Data-Driven Storytelling****
A study by Standford’s professor Chip Heath (Made to Stick author) found that 63% of people could remember stories, while only 5% could remember statistics. Although 2.5 statistics were used on average in the exercise and only 10% of the participants incorporated a story, the stories are what caught people’s attention.
This shows how important it is to use data storytelling to drive a data-driven culture. Data storytelling is invaluable in business because it allows us to see trends, understand problems, or interpret how our website or email marketing campaigns are performing. Data by itself cannot provide that meaning because it must be understood in the context of the situation. Using elements of the story helps us understand the context.
Here are some additional reasons to use data-driven storytelling as a communication tool:
- Meaning & value – data stories add value, meaning, and context to data so that the audience can connect the dots and put the insights into action.
- Credibility – numbers, and facts can validate your claims and increase the credibility of your content, as well as build trustworthy relationships with your audience.
- Attention – a great piece of data-driven content stands out and can elevate your brand by introducing it to a whole new audience.
- Versatility – data stories can be incorporated into many internal and external communication channels, such as case studies, videos, website content, presentations, white papers, and more.
In general, organizations can do a lot more and achieve greater results using their data if they understand it better. In a Forbes article, Brent Dykes’ author of Effective Data Storytelling: How to Drive Change with Data, Narrative, and Visuals, writes,‘’ In 2020, as we enter the next decade of data, you will need more people who are fluent in data. Along with increasing the overall data literacy levels of your employees and managers, it is imperative that your company starts developing a cadre of data storytellers who cannot only find insights but share them in clear, meaningful ways.’’
So, not only should your organization invest in BI and embedded analytics tools that empower data-driven decisions and bring real-time, interactive data visualizations, but it should also invest in data storytellers.
Get Your FREE PDF Copy
Fill out the form to get access.
Sorry, it seems that we have run into an issue with the form. Please try again in a few minutes. If you still experience issues, please contact us at support@revealbi.io to notify us of the issue.
Required
Unfortunately, Google has considered you a bot. Please feel free to contact support@revealbi.io to obtain the asset you were looking for or choose to schedule a demo of our products. Please accept the form terms to submit successfully. This email address doesn’t appear valid. Please update and try again. Please use a business email address.
Country
Business Email
First Name
Last Name
I understand and agree to the terms of Infragistics’ Terms of Use and Privacy Policy
This site is protected by reCAPTCHA and the Google Privacy Policy and Terms of Use apply.
Download PDF

Your PDF is downloading!
Enjoy reading and learning.
PDF: Get our FREE ‘’Embedded BI Features Checklist’’ guide and find out which are the essential features and considerations for selecting the ideal embedded BI solution for your organization’s needs. Download the PDF here!
How Does Storyboarding Help in Data Storytelling**?**
Storyboards are visual representations of the content you plan to create. In data storytelling, the storyboarding process is a great way to pull the key message and data elements out of long and complex reports and arrange them in order to tell your data story. This process helps in transforming abstract ideas into actual plans.
The storyboarding process in 4 easy steps:
-
Outline – in the first step of the storyboard process, you have to extract the key data points: what do you want to tell your target audience?
-
Sketch it– use this step to list all of the messages that you anticipate needing as raw material and sketch them in the squares of your storyboard. Make sure that you’ve gathered all the information and key points for your data story.
-
Arrange the storyboard– think about how this story will unfold and whether there are any missing points you won’t need.
-
Brainstorm visualizations– the last step is to think about how you’ll visualize your data and try different ideas.
The most important part of the storyboarding process is finding the key data points and messages that you want to include in your story. After that, and with the help of a visualization editor, your data story will surely be on point.
Data-Driven Storytelling Examples
Many brands out there already use data storytelling without you even realizing it. We gathered a few examples of brands that have already mastered data-driven storytelling so you can see how powerful it could be.
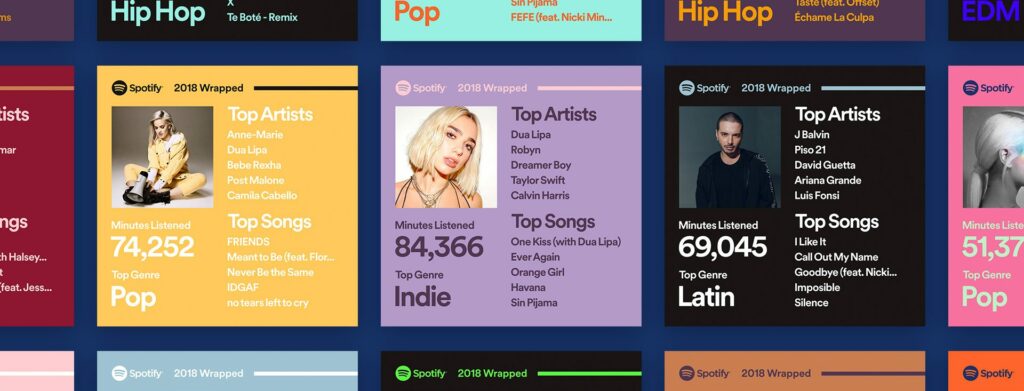
Spotify
Spotify is one of the best examples. The streaming service collects data about what songs, artists, and playlists its 345 million users listen to. They use the collected data to suggest new music to each one of these users catered to their individual interests, as well as to create original content for their Spotify Insights blog.
Spotify Wrapped is a notable example of how they use data to tell a story. At the end of each year, the music app creates a unique presentation for each user summarizing the past year in music listening.
Uber
Similarly, Uber uses data storytelling to communicate with its users on a yearly basis.
‘’We wanted to remind people of the role Uber plays in [users] lives and demonstrate how the use of the ridesharing service is a partnership that enables them to move across cities every day.’’ – Uber’s Eshan Ponnaduran
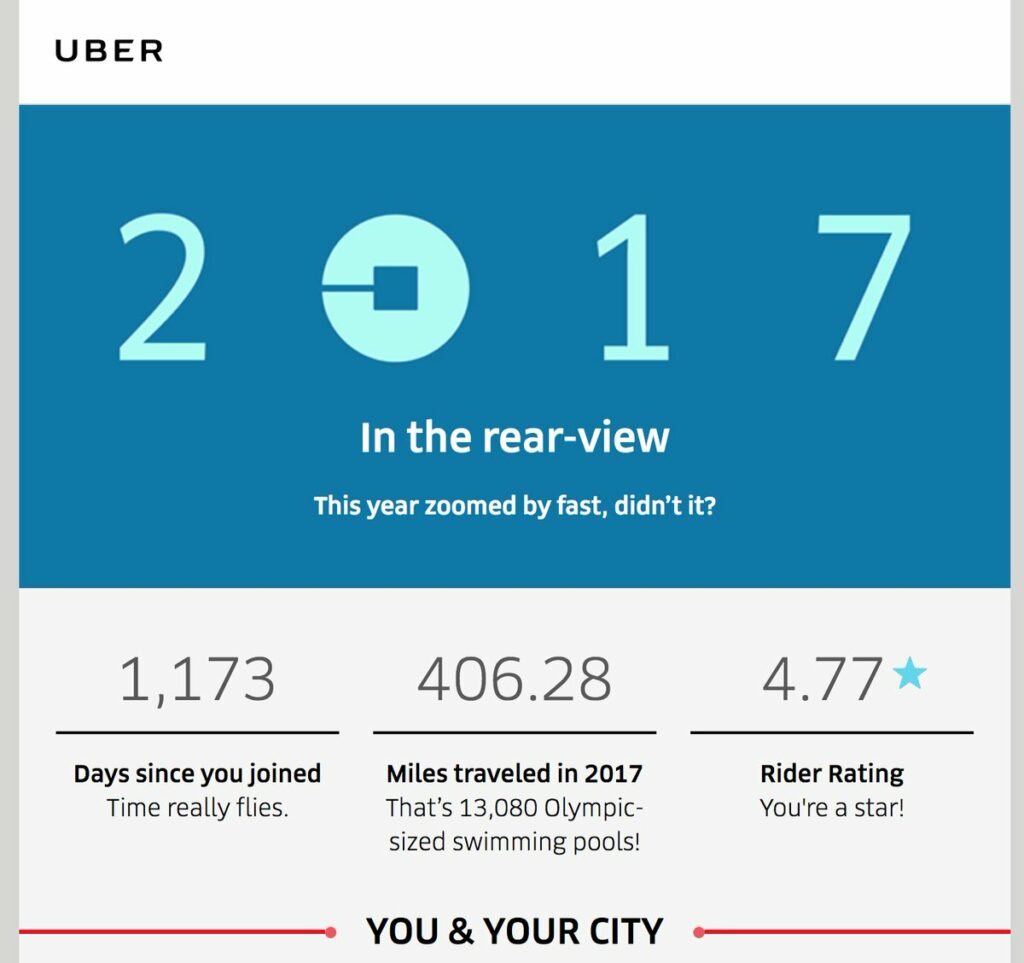
You can see how Uber has used accurate data, narrative, and relevant visuals – all three components of good data storytelling.
The Fallen of World War II
And the last example is a data-driven documentary that illustrates the human cost of World War II. This example is very powerful as the way that data was transformed into the story is very emotional.
In conclusion, we will say that if you are not using data-driven storytelling in your business, you are missing a lot. Your organization likely has abundant raw data waiting to help you and your team make complex data-driven business decisions and support the value of your allegations, ideas, and points of view.
