
Scriptly Helps Pharmacies Identify Trends in Real Time with Reveal
Businesses in the finance industry embrace the power of embedded finance so they can deliver better solutions and satisfy consumers’ demands. Embedded financial services are more convenient and provide a significant improvement in customer experience. This revolution in finance services reshapes and modernizes the way companies drive revenue and how brands interact with their customers.
Watch a Demo BOOK A PERSONALIZED DEMO Request a Demo FREE TRIAL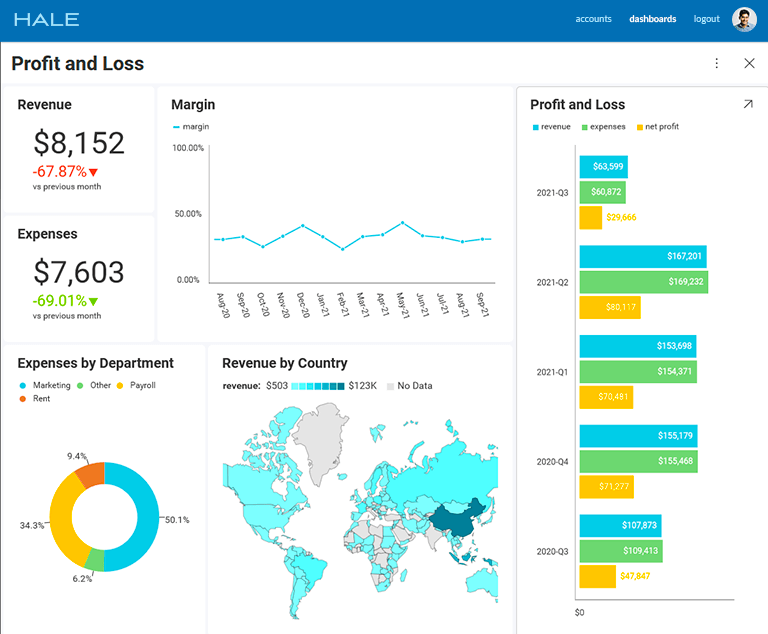

Finance analytics arms CFOs with the tools they need in order to better understand and analyze data so they can lower costs, drive higher revenue, add more value to customers and get ahead of the competition. For example, digital platforms that weren’t initially offering financial services along with their existing offerings but now do become more attractive to customers, improve customer retention and increase their revenue. Consumers, on the other side, get access to more convenient applications, better and cheaper financial services, customized offerings and better customer experience.
Offering embedded financial services opens up the door to additional revenue streams. Companies can charge small fess on in-app transactions, by providing credits to customers in the form of interest payments, when users swipe a debit card with embedded finance features and more.
Users are no longer being redirected to multiple applications to complete a single payment, but instead can complete entire purchases and pay bills without having to switch between apps or even leave the comfort of their home. When users don’t have to deal with 3rd party vendors, the relationship between customers and the company improves significantly.
Finance analytics generate data-driven insights and help businesses make smarter and informed decisions. With real-time data at your fingertips, you can make better decisions about the shaping up of future business goals, short and long-term strategies, optimize and improve operational efficiency, make investment decisions more confidently, and lots more.
The abundance of marketing, sales and customer behavior data makes it easier to forecast sales accurately, as well as predict demand for future products and services.
Finance dashboards enable financial professionals to gain deeper insights into the company’s overall financial performance and act at the right moment. Visualize and track all your financial KPIs in the following types of dashboards:
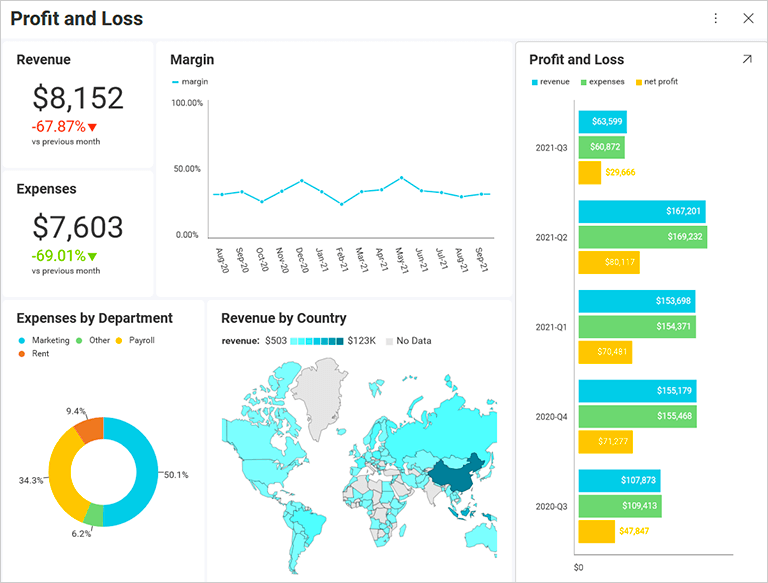
The profit and loss financial dashboard summarize the revenue, expenses and costs acquired over a specific period of time, usually throughout a fiscal quarter of the year. With the insights gathered in this dashboard, viewers can learn the answers to so many questions including why the business lost money or how to revenue and expenses compare to the last report.
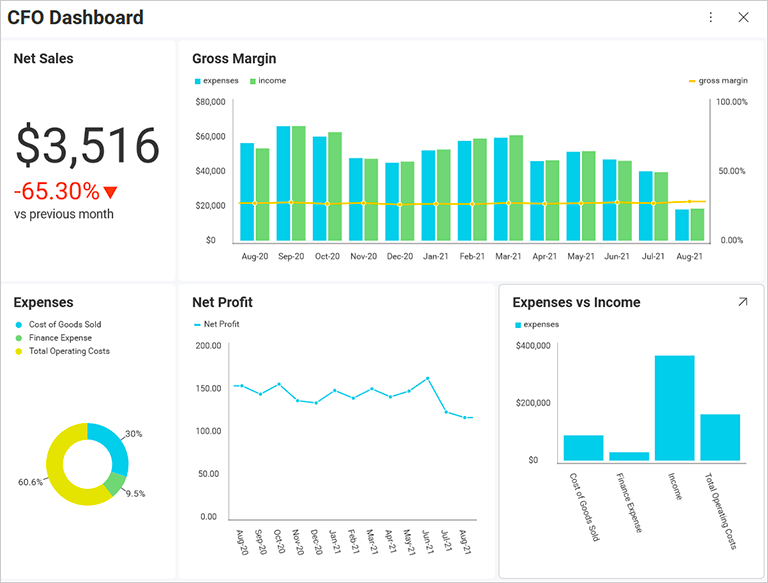
A CFO dashboard provides a view of all the information the CFO needs to perform their day-to-day activities in the best way possible. It includes the key financial areas that are most relevant for CFOs such as costs, sales goals, gross profit, plus employee and customer satisfaction metrics. They all help them get a clear picture of the overall financial health of the company and optimize future strategies and activities accordingly.
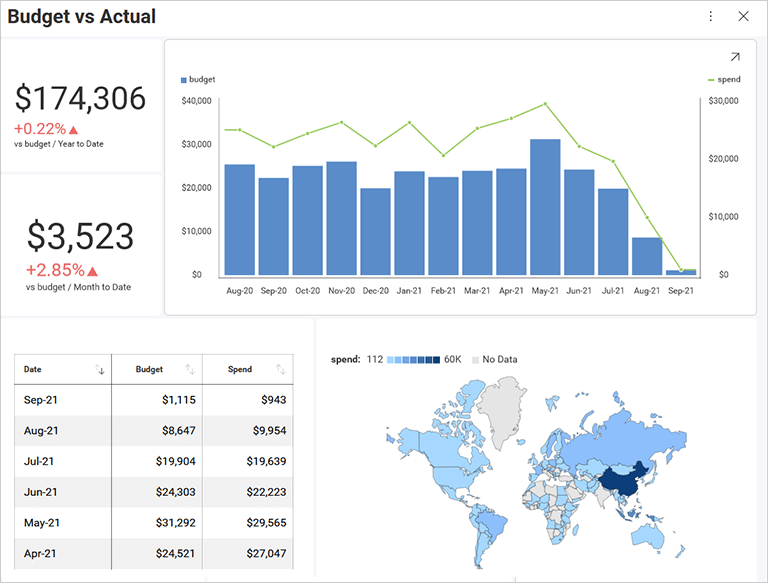
The primary goal of the budget vs actual dashboard is to make it easier to track whether a project in staying on budget or whether it’s likely to exceed costs in the process of completion. It displays a visual comparison of the project budget and the actual amount spent on it for the moment.
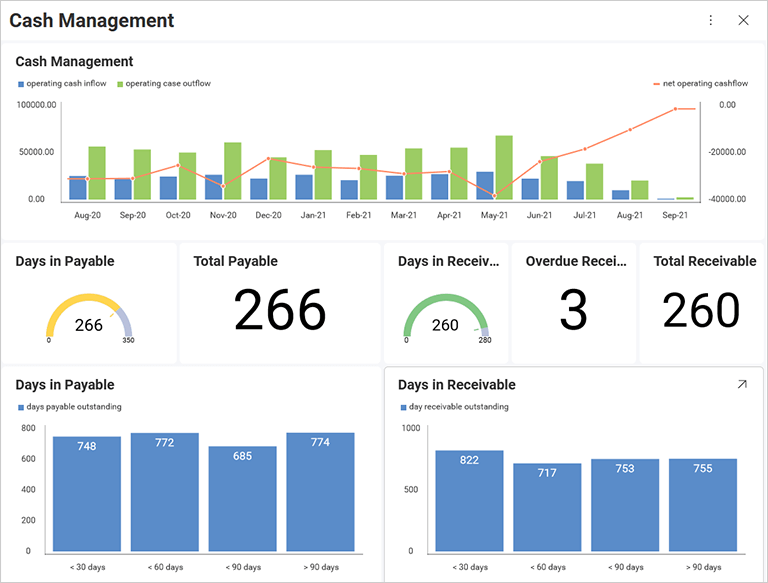
Cash management dashboard helps businesses understand their current cash flow situation – how much money comes in and how much money goes out of the business. It allows you to visually track month-to-month cash flow, spot patterns and compare performance.
Embedded analytics provides real-time reporting, interactive data visualization, and advanced analytics capabilities directly into finance applications. The visualization, reports, and analysis features are placed directly within the financial application user interface to improve the context and usability of the data.
Embedded analytics is a catalyst for change in finance, transforming how businesses generate revenue and interact with customers. By seamlessly integrating analytics into existing financial platforms, organizations can unlock new revenue streams, enhance customer value, streamline decision-making, and forecast sales with precision.
Financial analytics software is a management tool used by finance professionals and CFOs to leverage existing business data and get forward-looking insights that help them shape their finance decisions at the moment, tomorrow and in the longer term. It provides the technology to help them analyze this data, visualize it and make informative reports.
Imagine this: You go to the bank to request a loan. Given your bank profile and request, the banker has to approve or decline your loan request. Financial analytics helps the banker make his decisions by providing him with not just simple reporting, but with interactive visualizations like graphs and charts that can further back up approval or denial. These insights assist the banker’s decision-making process whether to approve or decline your loan request and even suggest different offerings tailored to you as a customer and your bank profile.
Back to Top