Traditional business intelligence and analytics solutions are made for data analysts and technical users.
But in today’s fast-paced business environment, all users, regardless of skills and department, need quick and easy access to data and the ability to work independently.
Drag-and-drop analytics are interactive and user-friendly analytics platforms that allow users to analyze complex data sets and build custom dashboards and reports when needed.
In this article, we are focusing on the importance of drag-and-drop analytics, how it improves user experience and increases user satisfaction, and what else to look for in drag-and-drop analytics software.
What Is Drag and Drop Analytics?
Drag-and-drop analytics refers to embedded analytics and business intelligence (BI) tools that enable technical and non-technical users alike to easily access and analyze data and build dashboards and custom reports through a visual, drag-and-drop interface (UI).
What Is the Drag and Drop Functionality Exactly?
The drag and drop functionality that is also commonly referred to as a ‘’WYSIWYG’’ (what you see is what you get) HTML editor is one of a number of UI approaches that enhances user experience by mimicking the natural human motions of picking up, moving and placing down virtual objects (buttons, forms, text boxes, etc.) into the digital world. The user-friendly design of the drag-and-drop functionality is very popular in the software world, and it typically aids in making complex tasks easier to perform for the general individual.
The Importance of Drag and Drop Analytics
Drag-and-drop analytics solutions are very easy and user-friendly. Here are the top benefits they present organizations with:
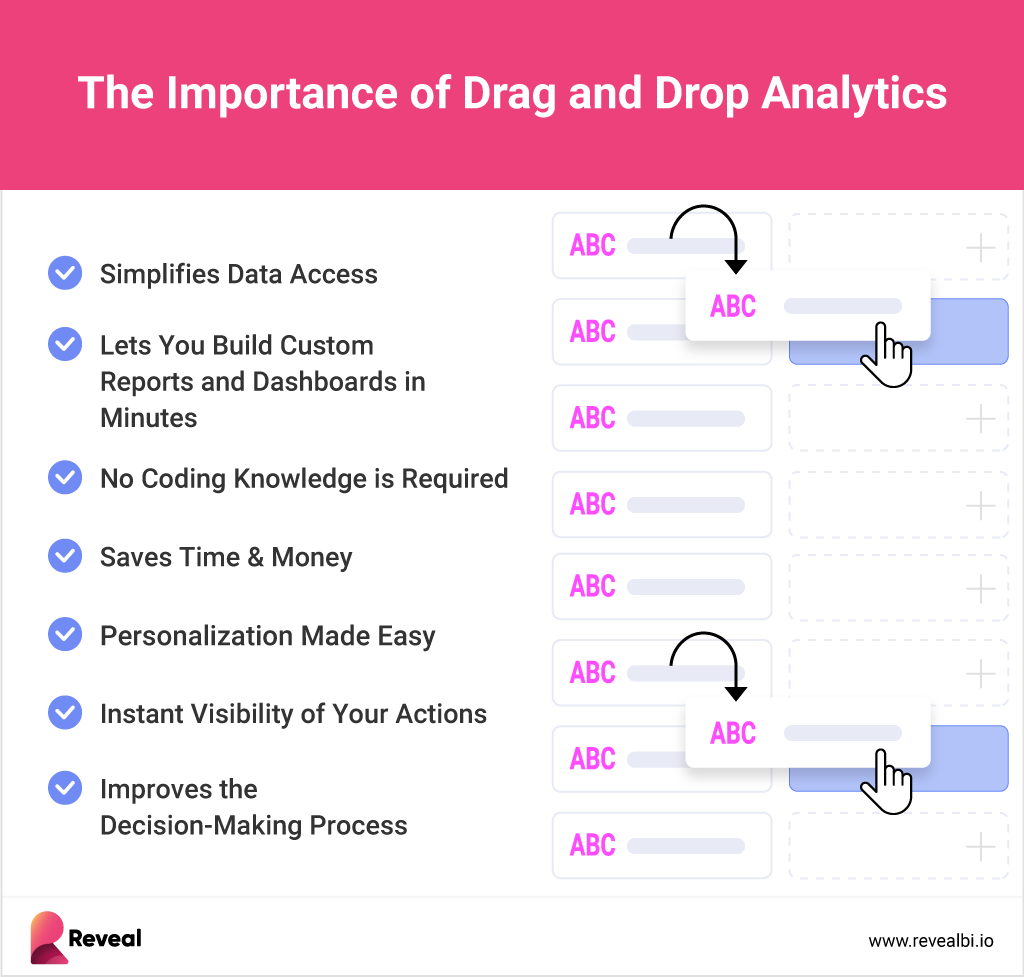
Simplifies data access
Drag and drop analytics makes data easily accessible for users of all levels and every organization’s department. It is the primary reason drag-and-drop analytics tools have been created – to provide equal opportunities for all types of users to access and work with data without waiting and relying on data analysts or IT professionals.
Lets you build custom dashboards and reports in minutes
Building custom dashboards and reports doesn’t need to take days or, in some cases, even weeks to be done. Think about being able to build your own custom dashboards and reports in minutes to be able to extract actionable data insights as quickly as possible. With drag-and-drop analytics, anyone can go beyond premade dashboards and report templates with ease. Just a few clicks can be enough to design a high-impact dashboard or a beautiful yet informative report.
No coding knowledge is required
Not every business user is an experienced developer or has knowledge in coding in general, let alone understanding complex programming languages such as SQL, Python, and R. With a drag-and-drop analytics tool, you don’t need to write even a line of code – non-technical users can visualize key business insights by simply dragging and dropping different UI elements and charts into one view.
Save time & money
One of the biggest advantages of the drag-and-drop analytics capability is the amount of time and budget that it saves an organization. When you provide your users with self-service drag-and-drop BI functionality, you’re going to save your company money on hiring and paying for a dedicated analyst team. And finding and forming such a team is also a very time-consuming task. You can save on both with one drag-and-drop analytics solution. Good deal, isn’t it?
Personalization made easy
The drag-and-drop dashboard creator experience is just the start. With a full suite of customizable visual UI/UX elements and white-label capabilities, you’ll have all that you need to fully transform the look and feel of your dashboards and reports to fit your brand perfectly.
Instant visibility of your actions
When using drag-and-drop analytics technology, you will never have to worry about what is/will happen with your dashboards. As drag-and-drop technology simply involves dragging elements into one view, you can clearly see how a certain chart, for example, reflects the overall dashboard/report picture instantly. This means that whenever you add, remove, rearrange, or link something to a certain drop location, you will see the result right away.
Improves the decision-making process
All the benefits of the drag-and-drop analytics experience that we mentioned above together help in improving the decision-making process. When users can take the building and customization of dashboards and reports into their own hands, they can extract key business insights much faster and, as a result, act at the moment of impact.
Drag and Drop Analytics Tools
Many embedded analytics and BI software solutions are offering drag-and-drop functionality as part of their offerings. But when you’re investing in such a solution, there is a lot more that you should be looking for to make sure that the vendor you decide to partner with is the right fit for your unique business case and users.
Some of the most important things that you need to consider when evaluating different drag-and-drop analytics solutions include modern and flexible architecture, embeddability, does the solution offer low-code/no-code BI capabilities, what is the integration process like, and what are the technical requirements to deploy drag and drop analytics.
Personalization, as we mentioned earlier, is of paramount importance, so you need to make sure that white-label capabilities are on offer too. And since drag-and-drop analytics is about working with and analyzing data, you should look for more advanced analytics features like dashboard blending, dashboard linking, data blending, in-context editing, statistical functions, and machine learning.
Introduction to Reveal
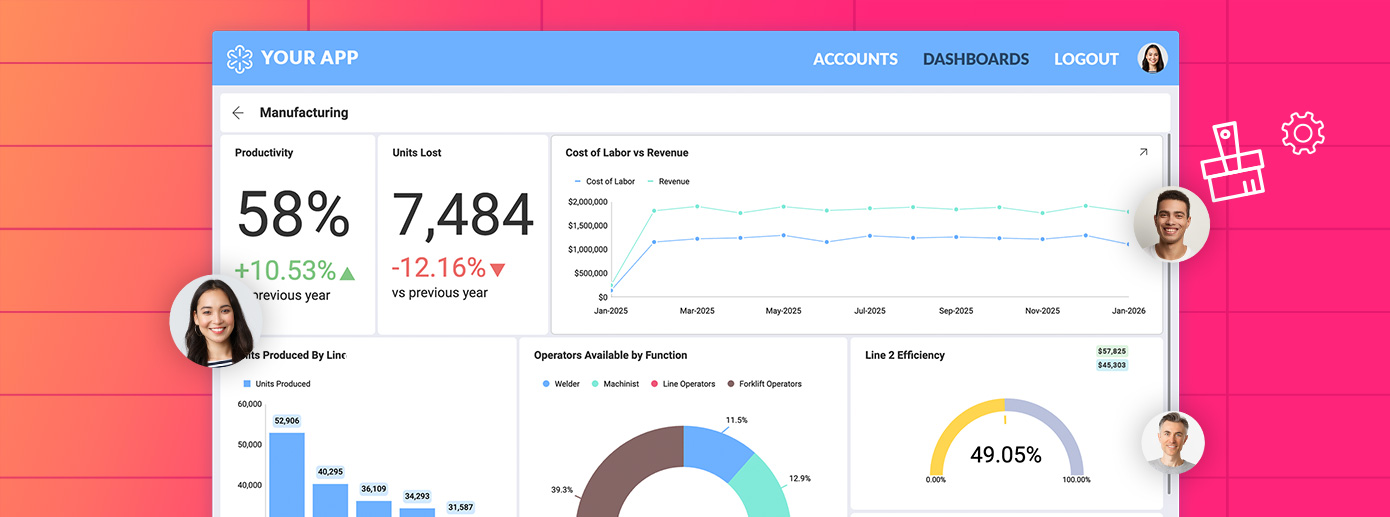
Reveal is an end-to-end self-service embedded analytics solution that brings the power of data into the hands of your employees, customers, partners, and suppliers. At its core, Reveal is centered around data-driven decision-making, and it has been designed to allow you to easily integrate interactive dashboards and data visualizations, white-label capabilities, drag and drop functionality, advanced and predictive analytics, including machine learning, forecasting, statistical functions, and more into your apps, so your users can access real-time insights and build beautiful and informative dashboards anywhere and on any device.
Reveal is available in both on-premises and cloud-based deployment models, and its native SDK can be integrated into applications on any platform and tech stack, including .NET Core, Java, NodeJS (coming soon), and front-end technologies such as React, Angular, WebComponent, VueJS, jQuery, MVC and Java Frameworks like Spring, Tomcat, Apache. Reveal embedded analytics also offers native iOS, Windows, and Android apps.
Reveal allows users to connect to various databases, including online sources like cloud storage drives, social media platforms, and SaaS applications, as well as offline sources like Excel, SQL database, and more. Users can choose from multiple visualization types and create and share real-time dashboards to monitor and display key performance indicators. As well as being shared across teams, dashboard instances can also be integrated into any third-party application.
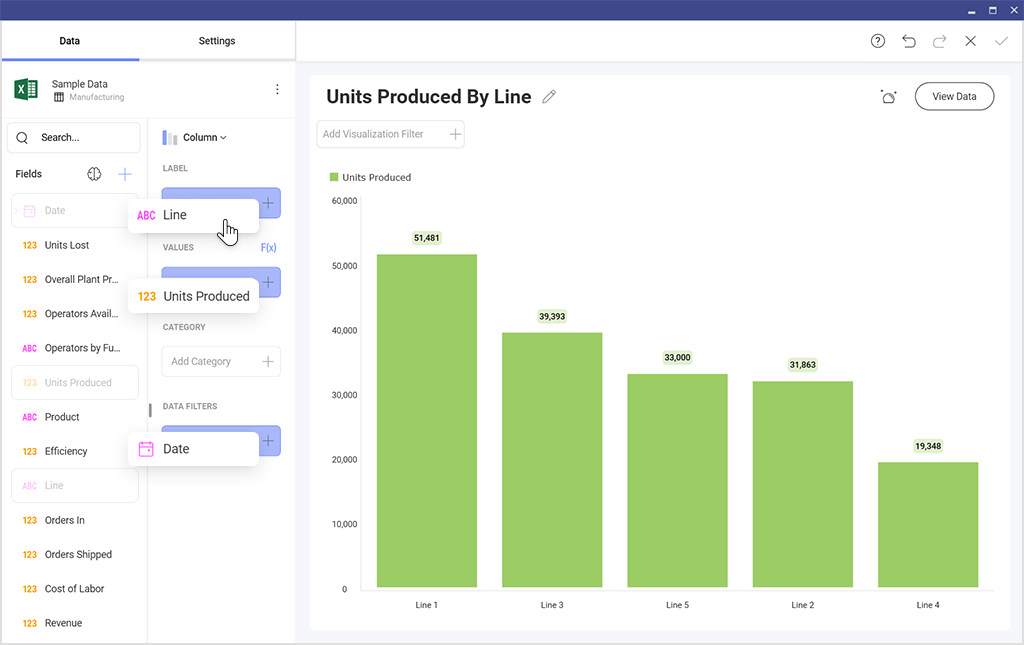
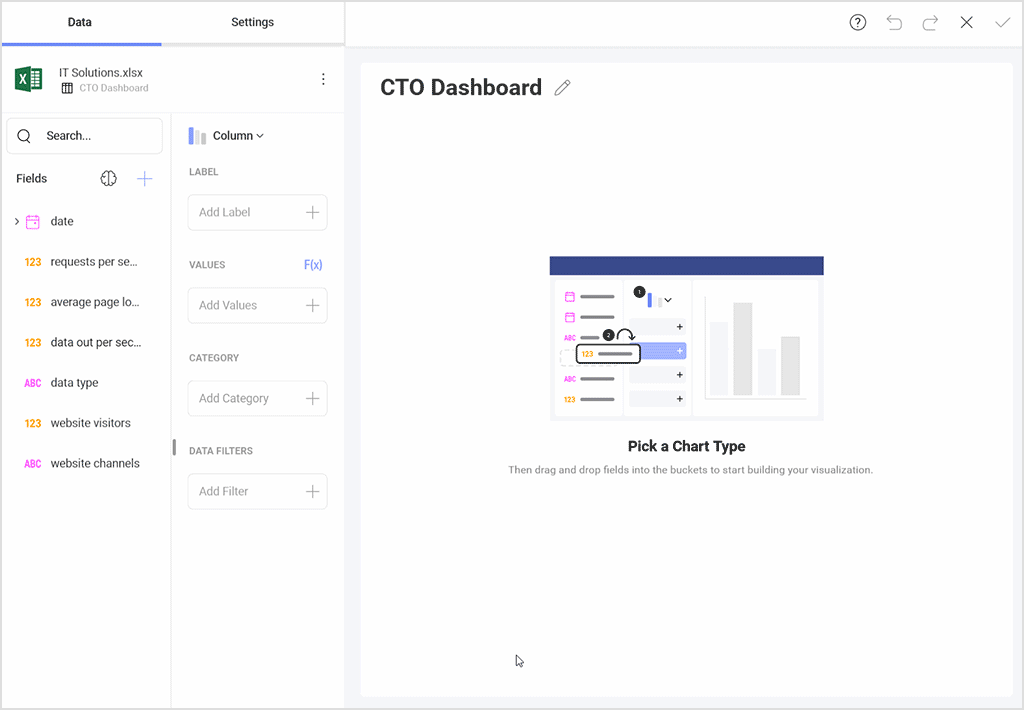
Reveal’s Drag and Drop Analytics Capabilities in Action
See how Reveal’s drag-and-drop analytics capabilities can let you easily build dashboards and custom reports on your own:
You can learn more about Reveal and how it works by downloading our SDK or by scheduling a quick demo.