Scriptly Helps Pharmacies Identify Trends in Real Time with Reveal
Identify trends and patterns, understand complex information quickly, communicate insights, drive better and smarter decisions!

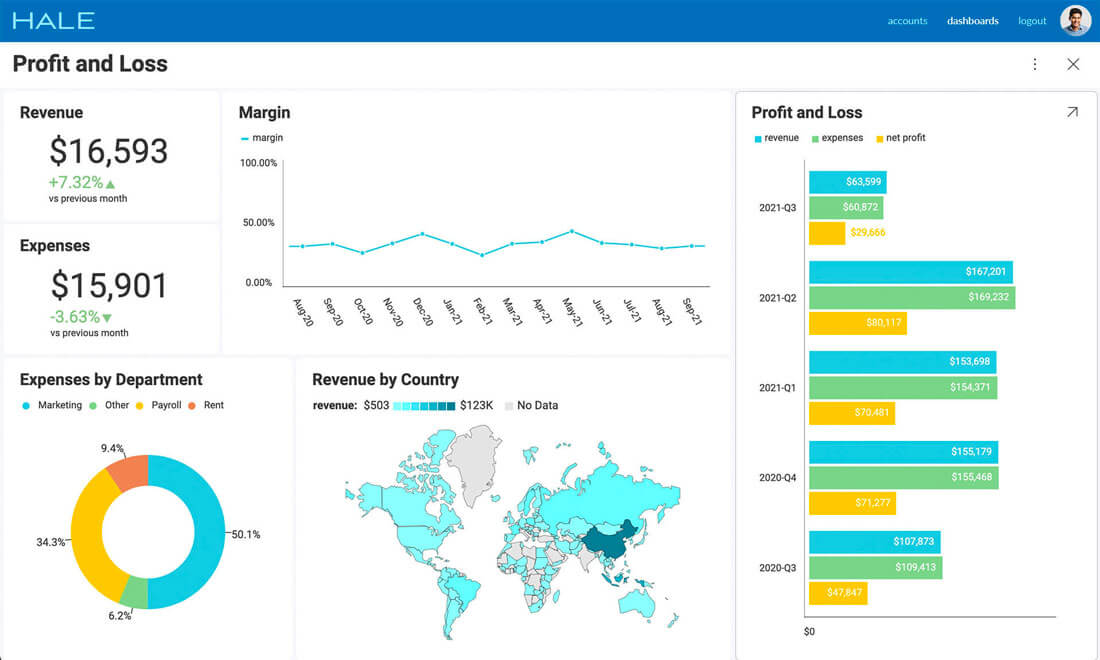
Choose the right chart to help you best visualize your organization’ data and extract actionable insights from it.


We are programmed to think visually. Therefore, transforming raw data into a visual story is the best way to convey the meaning of data and understand it in the context of a situation. Data-driven storytelling triggers emotions, influences actions, and helps organizations give numbers a voice in an understandable, memorable, and attractive way.

Back to Top