
Scriptly Helps Pharmacies Identify Trends in Real Time with Reveal
Real estate analytics harnesses the power of data and AI to uncover microtrends and insights that drive property value. Real estate firms, asset owners, and managers can get an overall picture of a location’s future opportunities and risks to build confidence in making the best decisions when it comes to real estate whether it is buying, selling, renting, investing, brokering, or planning real estate.
Watch a Demo BOOK A PERSONALIZED DEMO Request a Demo FREE TRIAL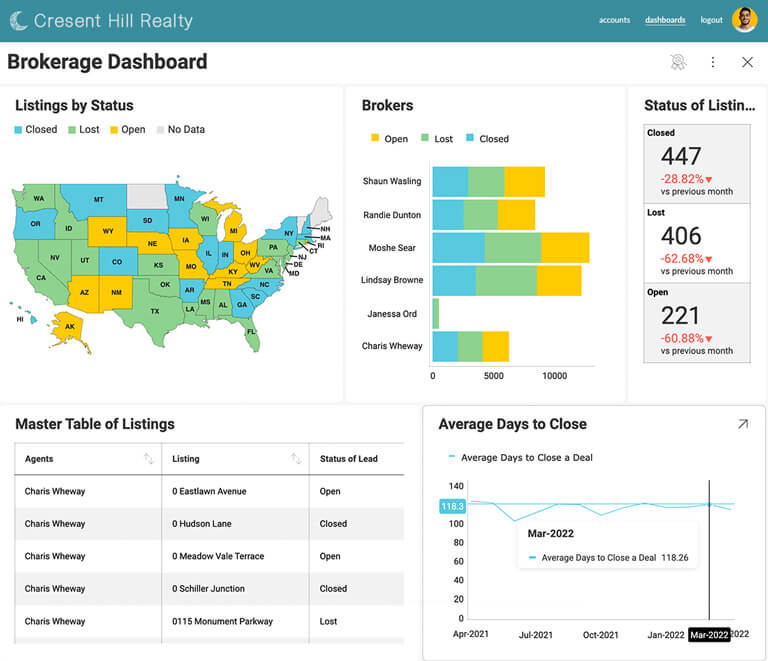

Nowadays, more and more real estate companies and professionals are turning to data-driven real estate analytics for its ability to ensure wise, profitable decisions. Realtors can easily find the best places to invest in real estate and confidently decide whether it would be best to rent out a given property the traditional way or to opt for services like Airbnb. By extracting the best out of every possibility, they can build wealth to grow their business and improve their competitive advantage.
Real estate professionals can appraise homes easier than ever before. Predictive algorithms and AI models help them base prices on current market trends and years of market data such as current supply, demand, sales volume, property characteristics, and more. In that way, analytics allows real estate firms to stay competitive and grow.
By utilizing data analytics in real estate, you can also improve the way you market your properties. For example, analytical tools can use digital advertising and search engine data to help realtors refine their audience and target potential buyers. They can also help them better understand what customers want and respond with personalized offers.
With all of the data about properties and buyers already stored online, real estate analytics makes it easier for buyers and sellers alike to get the information they need in real-time and move all the deal related documents and processes online.
Real estate analytics uses the insights gathered from data to improve realtors’ decision-making on all levels. As a result, real estate companies and investors can lower their costs by identifying more efficient ways of doing business, and ultimately increase their revenue.
Gain a complete overview of your real estate business and quickly identify problems and opportunities before they happen.
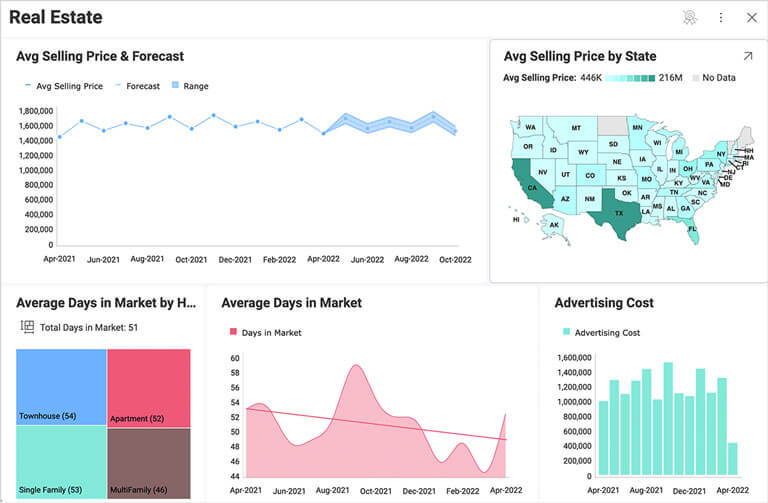
Tracking your real estate business operations is super easy with a real estate management dashboard that allows you to gain deep insights into your data from one convenient location. Monitor the number of days on the market, sales by region, advertising and promotion costs, and more to improve your overall productivity and ultimately increase sales and rental revenue.
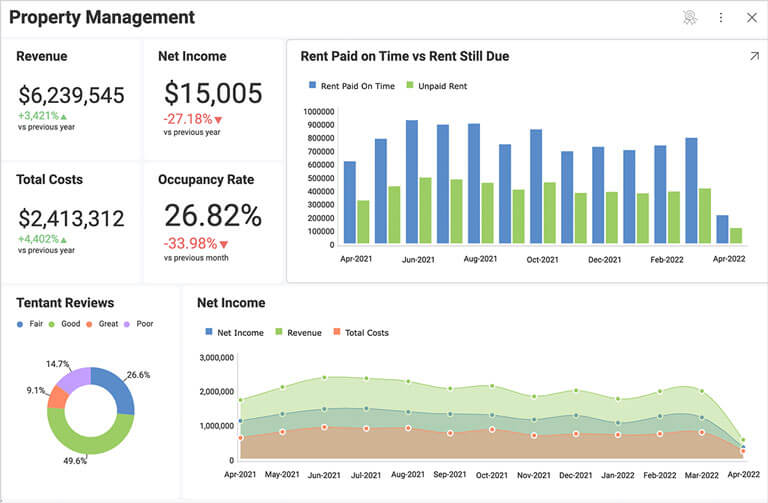
Property managers need to track bookings, tenant data, financial metrics, maintenance costs, repairs, and so much more. By gathering all the important data in one place, analytical tools allow property managers to identify peak demand dates and set up their prices accordingly. Furthermore, they can predict future occupancy and analyze competitors’ listings performance.
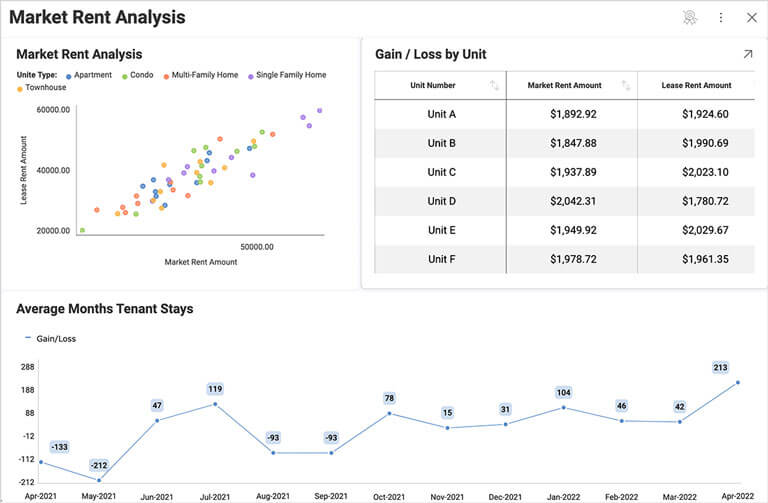
Build interactive market rent analysis reports to assess the rental potential of a specific area. You can filter data by many criteria such as unit type, gross potential rent, gain/loss to lease and more to get a better understanding of properties potential and shape your sales strategies more intelligently.
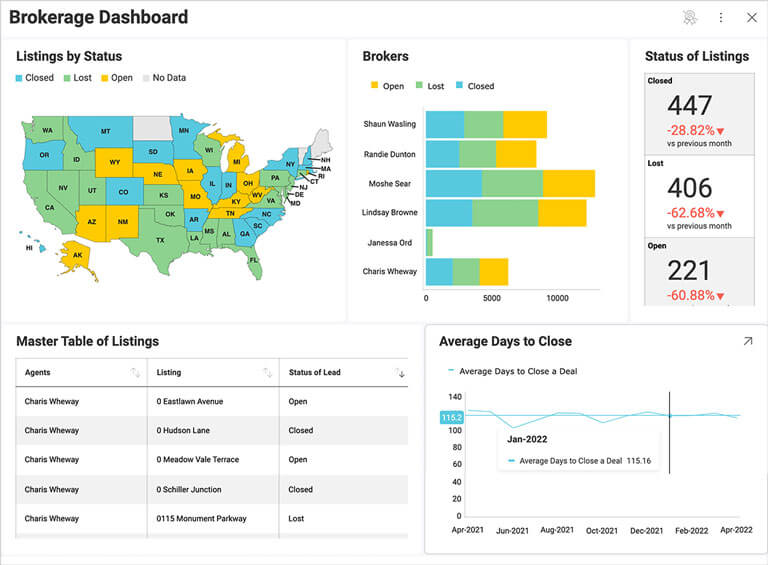
A brokerage dashboard gathers key information about your brokerage agent’s activities and performance and lets you track the average days that it takes them to close a deal, the number of total leads received by the agent for a given period of time, a summary of listings of each agent, etc.
Embedded analytics provides real-time reporting, interactive data visualization, and advanced analytics capabilities directly into real estate systems and processes. The visualization, reports, and analysis features are placed directly within these systems and processes to provide real-time data access and support business users’ decision-making capabilities.
Creating an interactive real estate dashboard is a breeze with an embedded analytics tool like Reveal. You just have to connect to the data sources containing your data, and the intuitive drag-and-drop interface allows you to design interactive charts, maps, and graphs to visualize your insights effectively.
Predictive analytics in real estate is a game-changer. By leveraging historical data, it enables you to forecast future trends and outcomes. For instance, it equips realtors with the ability to analyze customers’ buying patterns, build a profile of customer preferences, and predict potential buyers or sellers. This strategic insight also helps in predicting investment feasibility and demand in a specific location, and identifying future risks and opportunities, making you feel more informed and strategic in your decisions.
When evaluating different embedded analytics solutions, consider data integration capabilities, visualization tools, predictive analytics features, ease of use, scalability, and security. Furthermore, look for an embedded analytics solution that can provide customizable dashboards and a transparent, fixed price so that there are no hidden fees and surprises, and you always know what you’ll be paying.
Back to Top