In today’s ever-changing data world, traditional BI approaches, and business managers are struggling to keep up the pace, enhance efficiency, generate ROI, and boost business value. To get the most out of data, effectively predict future outcomes, and make more intelligent business decisions, organizations must bridge the gap between data scientists, business analysts, and the machines doing the work in the middle.
Guided analytics is the analytical process that equips data scientists with the right tools, skills, and preferences to collaboratively build, maintain, and continuously refine a set dashboard. These grant business users the right degree of user interaction so everyone could work together to generate more useful analyses.
Read this article to learn about guided analytics, its benefits and principles, and the pros and cons of guided analytics vs self-service analytics.
What Is Guided Analytics?
Guided analytics is an approach to predictive and visual analytics designed for business users based on their use cases and requirements. It provides the ability to build visualizations that serve as a decision-making tool for data analysts or business users when needed. Guided analytics can be used directly or as blueprints for building your own custom application from scratch.
Benefits of Guided Analytics
Ultimately, the guided analytics approach empowers end-users to quickly understand insights and information presented in a dashboard. The analyst’s goal is to create informative and user-friendly dashboards so anyone can dive in and understand the story quickly. Providing various options to slice and dice data enables consumers to gain deeper insights.
Another one of the benefits of guided analytics is that it helps keep teams on the same page with a centralized place for all business data where everyone can find the data they need.
The guided analytics approach can also be used to design apps as a standalone application or an embedded analytics product. Embedded analytics products deliver real-time reporting, interactive data visualizations, and/or advanced analytics, including AI and machine learning, directly into an application user interface.
There are many benefits of embedding analytics into your apps, one of the biggest ones of which is saving your developer’s precious time and effort on developing analytics from scratch for every single app.
Last, but not least, guided analytics allows users to explore the full data set in a secure data environment which boosts users’ confidence to extract the actionable insights they need to drive their decision-making process.
Guided Analytics Principles
Although there are dozens of principles of guided analytics, we’ve handpicked 7 which will serve anyone on their data analytics quest:
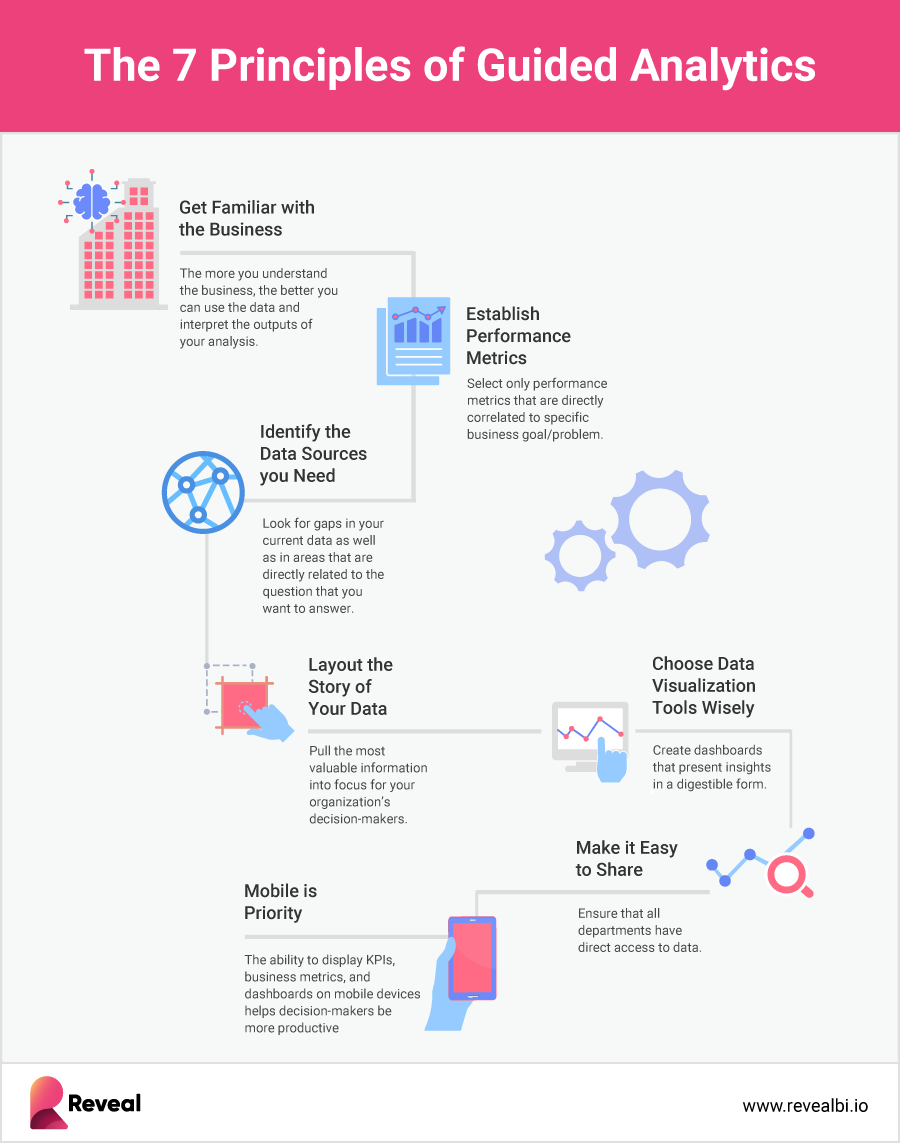
1. Get Familiar With the Business
This principle is the premise of the data analysis. You need to understand the context in which the data is being generated and used, such as business processes. The more you can discover about the business and the more you understand the problem, the better you can use the data and interpret the outputs of your analysis or modeling.
2. Establish Performance Metrics
The second very important data analytics principle is establishing clear performance metrics to successfully translate business goals into actionable results. To do that, organizations must decide what to measure, how to measure it and define the success metrics.
The right performance metrics to track should be relevant to your business strategy and goals, inform smart decisions, and represent an accurate measurement of performance. Make sure to choose your performance metrics carefully, and don’t overwhelm business users with unneeded noise. Select only performance metrics that are directly correlated to a specific business goal/problem.
3. Identify the Data Sources You Need
Now that you know the specific business goal you have to achieve or the problem you need to solve, it is time to start thinking about where to get the data you need. Businesses nowadays collect an abundance of data about all of their processes, sales, marketing activities, etc., so it shouldn’t be difficult to identify where to get the data you need from. For example, in a retail business, if you have to predict future sales and demands for the upcoming Holiday season, you will need to obtain data from the past Holiday seasons and explore the different trends and patterns.
4. Lay Out the Story of Your Data
Every business wants to make the right decisions. Right decisions rely on good information that is translated into meaningful, easy-to-understand insights. If your audience doesn’t understand the information that they are being presented, they’ll have little to no motivation to act on it. This is where data storytelling comes in.
If telling a story doesn’t come naturally to your analytical mind, don’t worry – crafting compelling data stories that inspire and motivate your organization to act is not that difficult to create. A good data story is formed by three components – data analysis, visuals, and narrative. Together, these three components put your data into context and pull the most valuable information into focus for your organization’s decision-makers.
5. Choose Data Visualization Tools Wisely
Data visualization tools are the different visual elements used to present your data in a way that makes it easier for all users to understand and gain insights. If people can’t understand the data, they cannot act on it, and nothing will change. That is why it is vital to create dashboards that present insights in a digestible form for those who aren’t data scientists and can’t extract information from strange charts and spreadsheets.
One of the key guided analytics principles is flexibility. In other words, you have to choose the data visualizations you present to users wisely and according to the demands and skillsets of the various users that will be interpreting the data.
6. Make it Easy to Share
Misinterpretation of data is as bad as not using data at all. The only way to cut down on this is to ensure that all departments collaborate and work together to translate and use the data. Proactively sharing data insights with the people you work with encourages engagement and collaboration, brings transparency to the workplace, and provides a way to work in partnership with others in your organization to improve efficiency and boost team results.
7. Mobility Is a Priority
Regardless of your business’s industry, being able to access real-time business insights at any time and from anywhere is crucial. Mobile BI, or the ability to display KPIs, business metrics, and dashboards on mobile phones and tablets, helps decision-makers be more productive and make the right decisions at the right time, every time.
Guided Analytics Use Cases
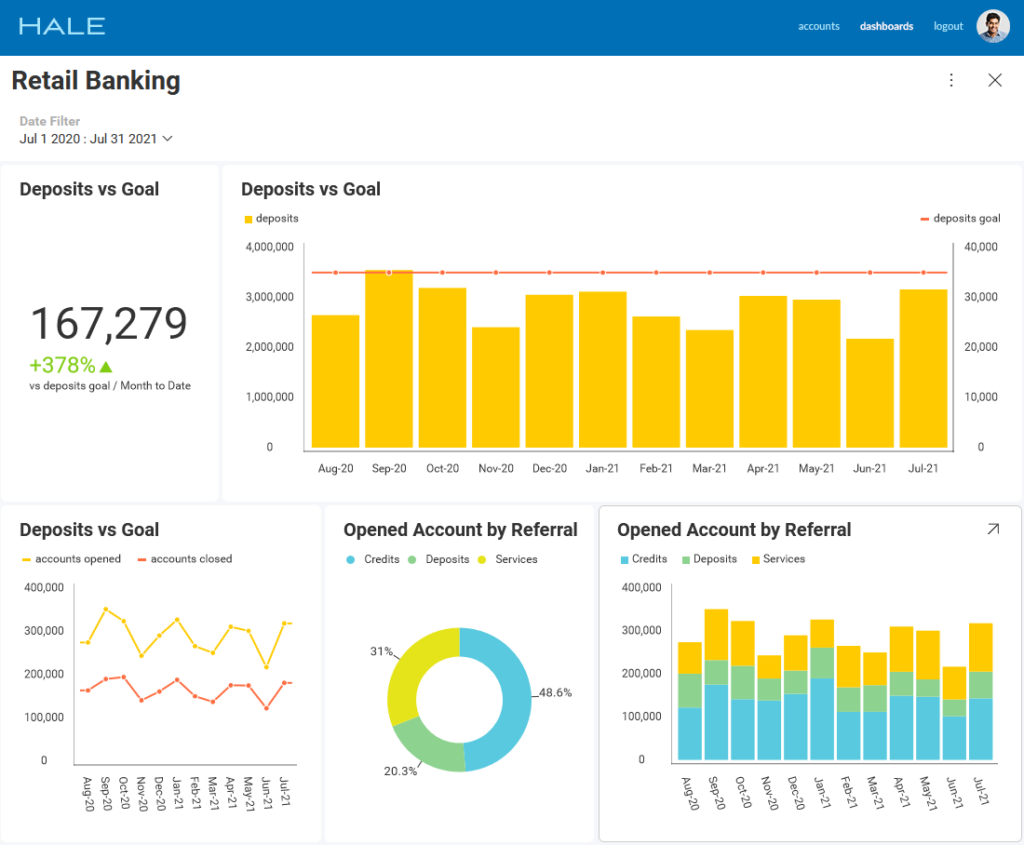
Guided Analytics in the Banking Industry
Data analytics greatly impact the banking industry, helping it consolidate internal and external customer data to build a predictive profile of each banking consumer. That allows banks to identify potential risks related to lending money to customers with poor credit scores. Banks are also using analytics to understand how their consumers use their accounts and identify trends that can help bank engineers create and maintain more user-friendly services.
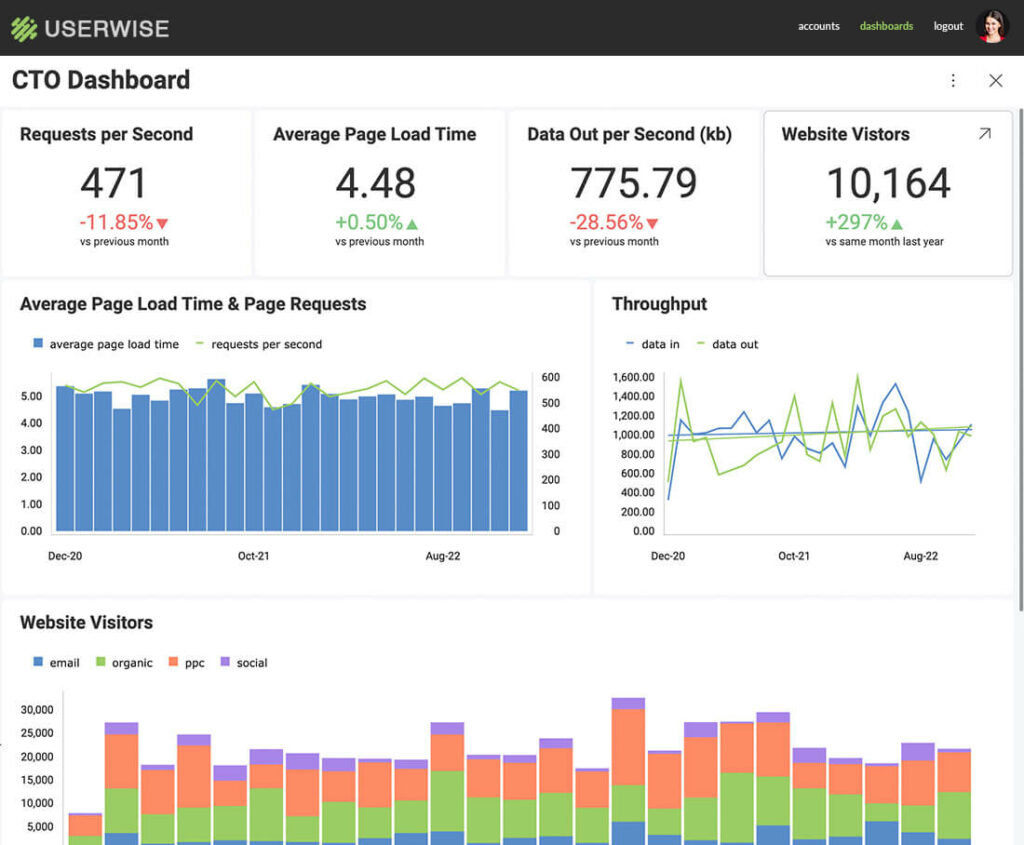
Guided Analytics in the IT Industry
In the financial sector, analytics can tell a business how they are performing compared to its competition, it can predict financial situations based on a vast number of scenarios laid out for the system to analyze, and much more. But how can data analytics help in the IT industry?
IT analytics bridges the gap between data, insights, and action so that IT companies improve to better serve each and every one of us in today’s modern technology world. With access to real-time data insights, ITs can understand trends involving operations and make better, data-driven decisions to optimize their services and offerings to stay competitive.
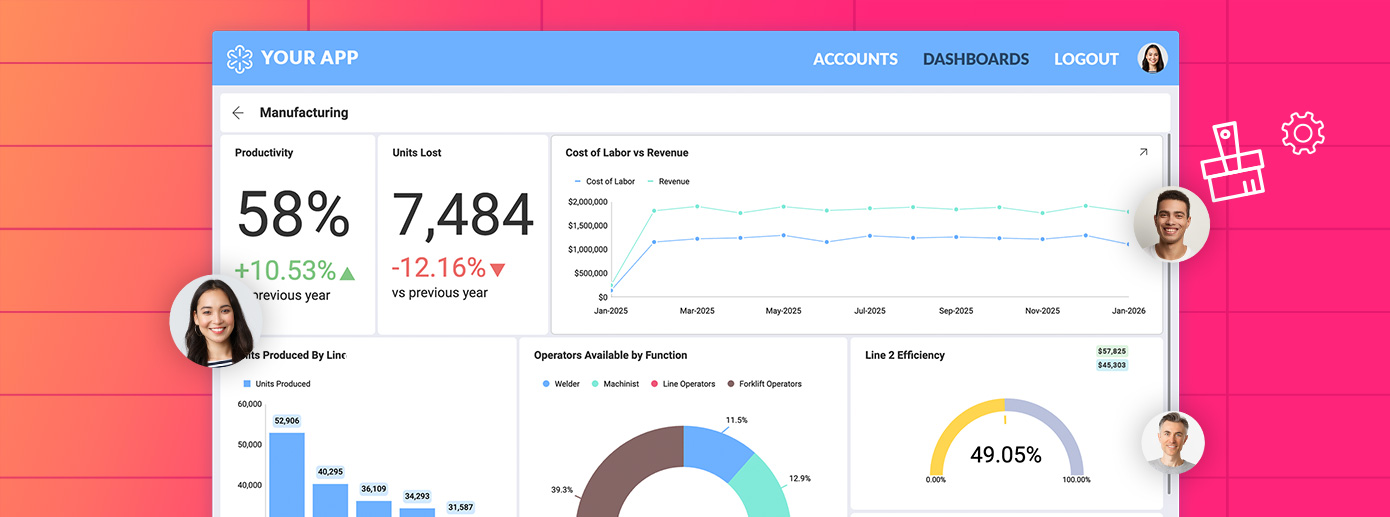
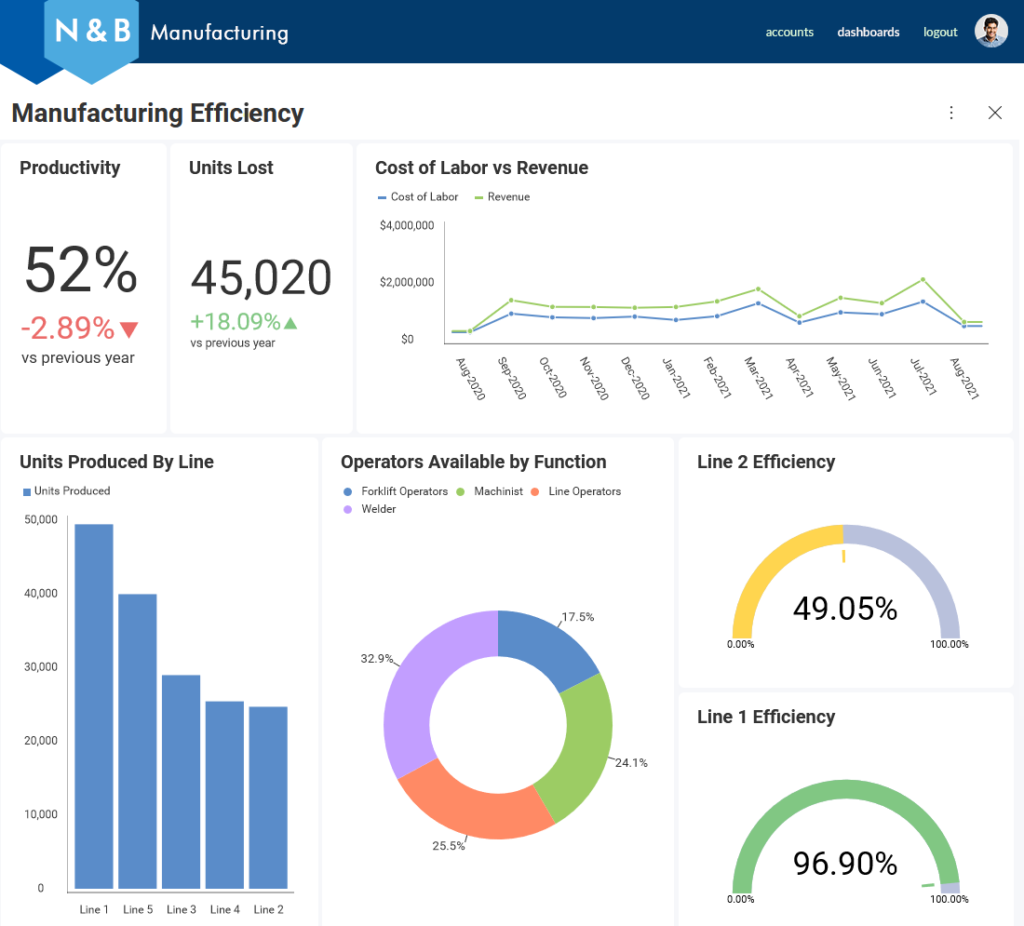
Guided Analytics in the Manufacturing Industry
Data from manufacturing and business processes holds tremendous business development potential. Leveraging manufacturing analytics, including machine learning algorithms, advanced analytics, and other data analytics methods and tools, presents many opportunities for manufacturers. These include but are not limited to preventative maintenance to reduce equipment maintenance expenses, maximization of equipment effectiveness, enhanced logistics for customer service, minimized downtime by machine operations automation, and increased accuracy in sales and marketing functions.
Guided Analytics vs Self-Service BI
Generally, two types of BI systems are guided analytics and self-service analytics. The main difference between the two is that when using guided analytics, end-users are dependent on ITs and data analysts, whereas when using self-service analytics, users can work with data and create dashboards and reports on their own.
For those of you who are not well aware either of guided analytics or self-service analytics, let’s explain that difference in more detail:
Guided analytics allows a company to set up, with the help of a developer, business applications featuring dashboards and charts that are updated based on user explorations and feedback. The end-user has no ability to create their own data visualizations, bring in one of their own data sources, or build dashboards and reports. Guided analytics BI operations are entirely owned by the IT team or dedicated business intelligence experts.
That means that when a user needs a specific report or dashboard to be created, they must request them to the dedicated specialists and wait for the IT or BI expert to deliver the report/dashboard, which might take anywhere from a few minutes to a couple of days. This causes frustrations and delays in getting the information that is needed for decision-making.
Contrary, self-service analytics empower end-users to explore any data they have access to and easily create reports and dashboards by themselves when they need them. Self-service BI tools provide intuitive drag-and-drop UI that makes interacting with data easier and more accessible for those who don’t have technical and analytical knowledge.
Modern analytics applications like embedded analytics solutions enable all of your application users to access and analyze data on their own by providing them with self-service and modern architecture capabilities. By using a self-service analytics approach that helps users find actionable insights when they need them, everyone can act at the right moment and never miss an opportunity.
Why Should You Choose Self-Service Analytics?
Today, every business user should be able to work and analyze data to drive his actions. Businesses that fail to harness this opportunity with the right BI approach are missing out on the huge potential of data-driven decision-making.
Reveal is a self-service embedded analytics solution that brings the power of data into the hands of your employees, customers, partners, and suppliers. At its core, Reveal is centered around data-driven decision-making, and it has been designed to allow you to easily integrate interactive dashboards and data visualizations, white-label capabilities, advanced and predictive analytics, including machine learning, forecasting, statistical functions, and more into your apps, so your users can access real-time insights and build beautiful and informative dashboards anywhere and on any device.
You can learn more about Reveal and how it works by downloading our SDK or by scheduling a quick demo.