
Scriptly Helps Pharmacies Identify Trends in Real Time with Reveal
Explore the complete guide to embedded analytics, including architecture, security, AI capabilities, implementation patterns, and evaluation criteria for modern applications.
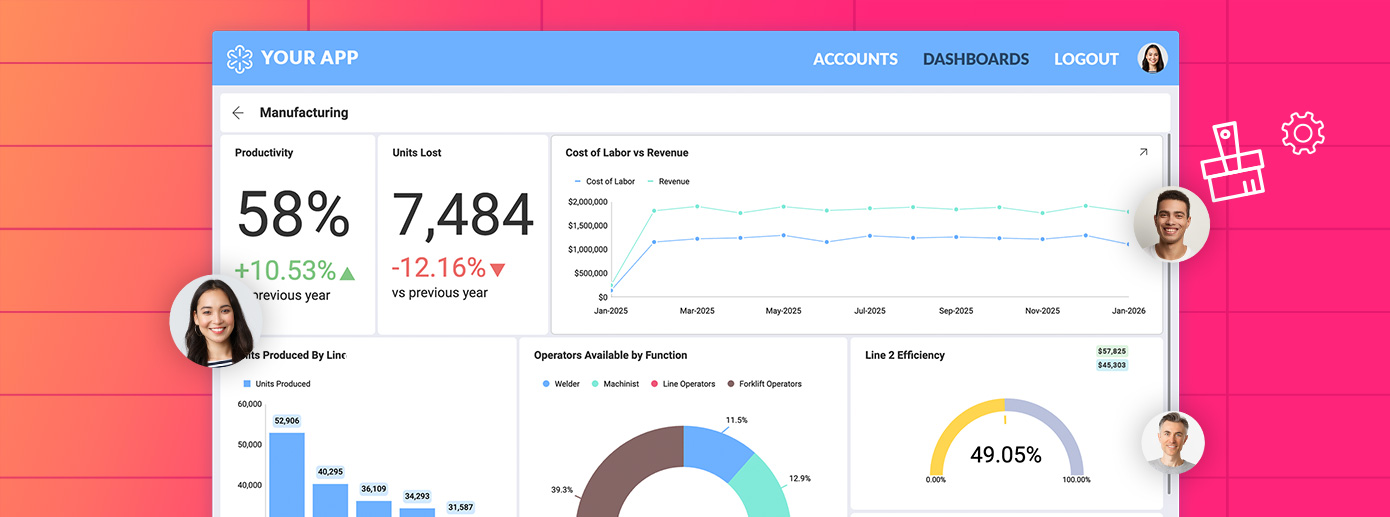
Read NowFully branded white label dashboards offer custom personalization so that your customers can present a holistic service that is all branded to one company.
Read NowReveal business intelligence blog gives you the latest embedded analytics trends, how-tos, best practices, and product news.
🎥 Watch the full webinar: Designing Embedded Analytics Your Users Actually Use
Continue reading...
Learn what an analytics SDK is and how to choose the right one for your SaaS product. See what to look for to scale without constraints.
Continue reading...
Struggling with dashboard adoption? Learn why users ignore dashboards and how embedded analytics drives real usage and better decisions.
Continue reading...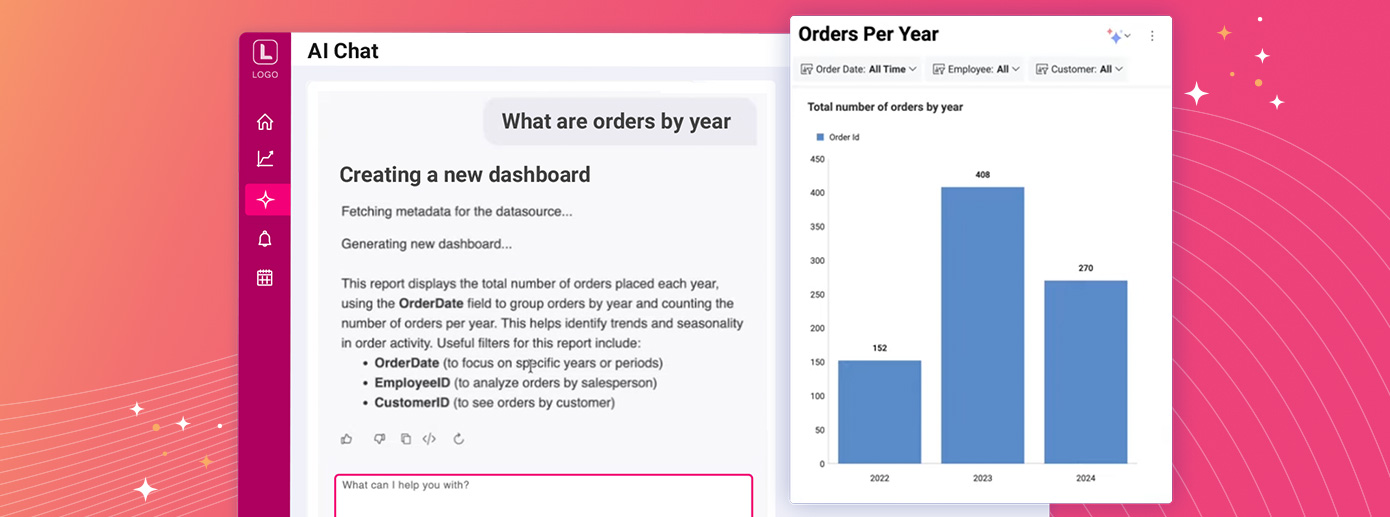
The SLM vs. LLM choice affects latency, token costs, governance, and deployment flexibility. See which one fits your embedded analytics needs
Continue reading...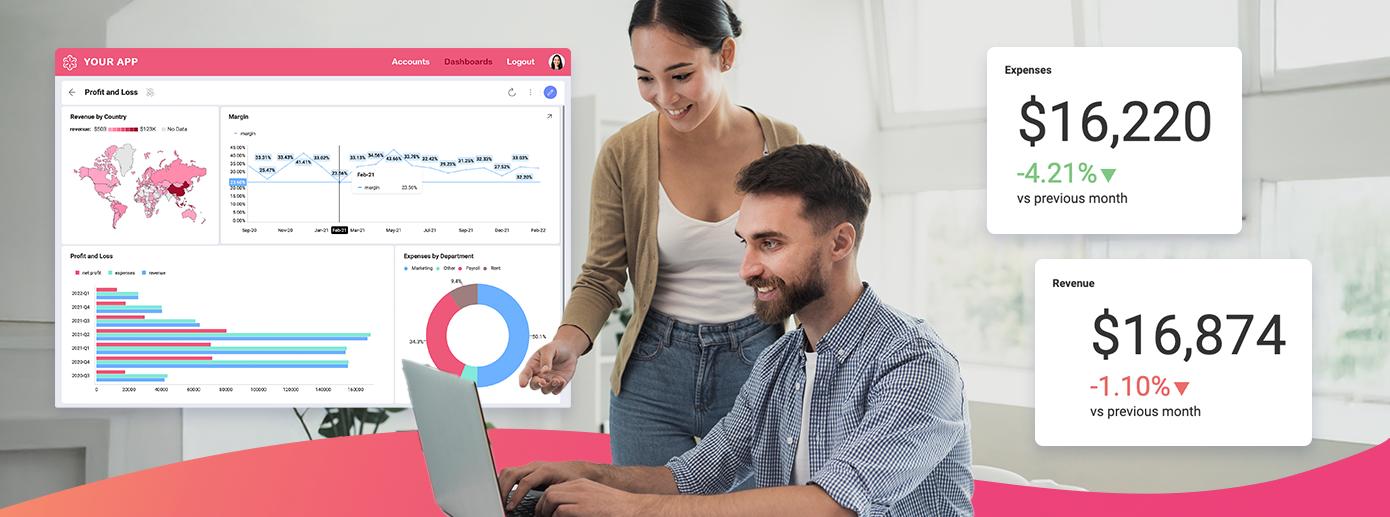
Learn how analytics adoption grows, why non-tech users struggle, and how leaders prompt new users to their product's analytics layer.
Continue reading...
Discover 5 effective strategies to overcome integration challenges in embedded analytics and enhance your analytics integration for seamless performance. Find out more.
Continue reading...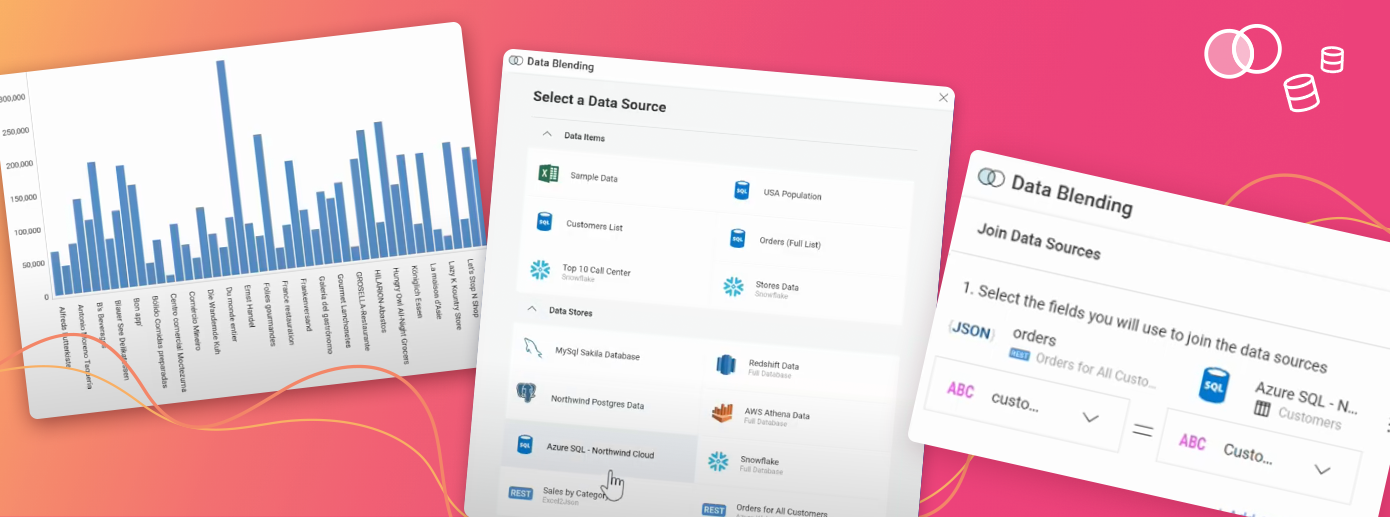
Learn about data blending. We cover what sets it apart, why it’s indispensable for modern business, and how it differentiates from the traditional data joining method.
Continue reading...
Explore the concept of dashboard templates and get a step-by-step guide on creating custom dashboard templates with the Reveal embedded analytics solution.
Continue reading...
From intuitive data exploration to pre-built dashboard templates, these are our top 10 embedded analytics ease of use features and functionalities.
Continue reading...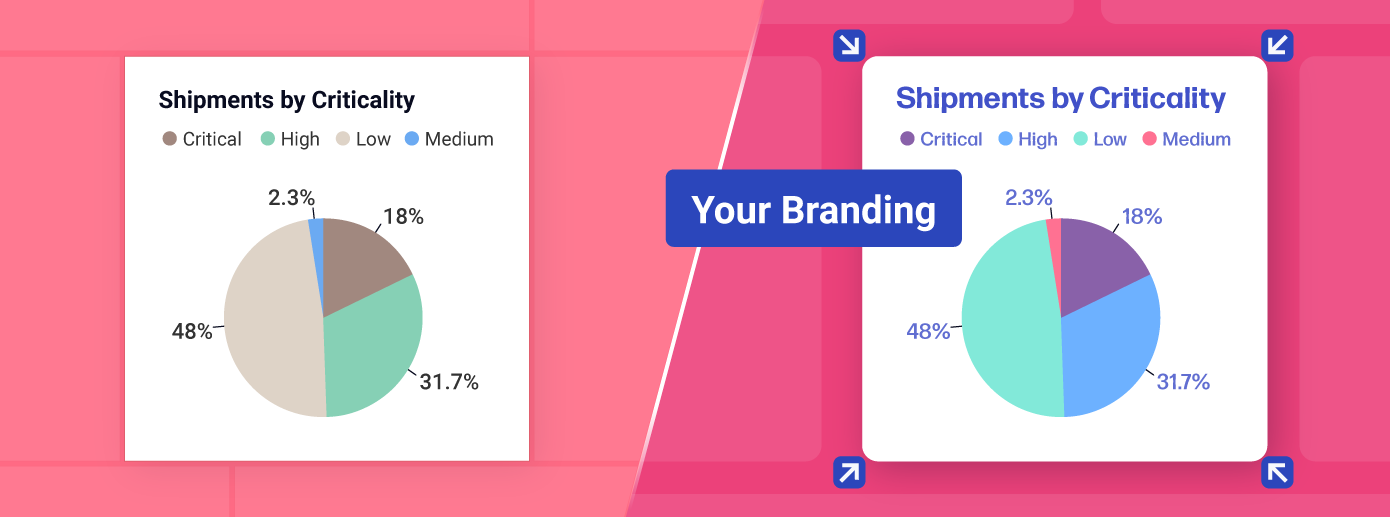
Delve into white label analytics, its benefits, and use cases and get expert guidance on selecting the ideal solution tailored to your requirements.
Continue reading...
