Explore the complete guide to embedded analytics, including architecture, security, AI capabilities, implementation patterns, and evaluation criteria for modern applications.
White-Label Software and Analytics: Enhancing Your Brand
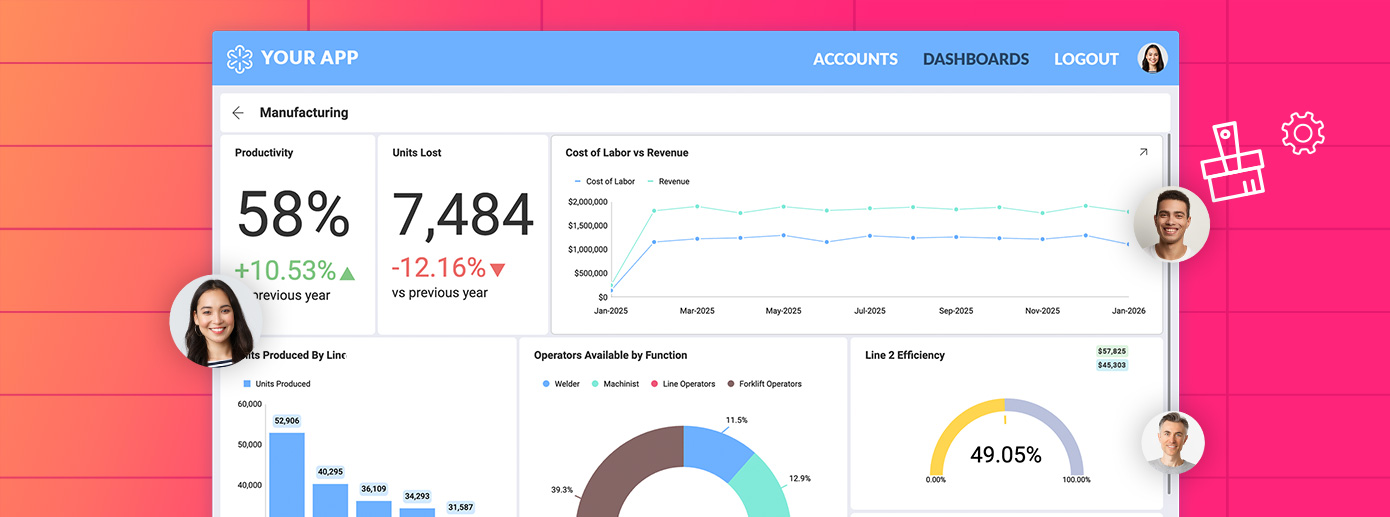
Fully branded white label dashboards offer custom personalization so that your customers can present a holistic service that is all branded to one company.
Did you know that the lack of in-context data prevents you from making smarter business decisions and missing out on key revenue opportunities? That’s the value of embedded analytics – it brings key data insights into the hands of your decision-makers, workflows, and applications that run your business.
Embedded analytics is becoming an integral part of business’s people lives. It brings the power of data to your employees so that they can make quicker and data-driven decisions without interrupting their workflow. Transforming raw data into actionable insights leads to increased productivity, seamless user experience, and ultimately revenue growth.
Continue Reading
Fill out the form to continue reading.
Form submitted
What is Embedded Analytics?
“Analytics software is uniquely leveraged. Most software can optimize existing processes, but analytics (done right) should generate insights that bring to life whole new initiatives. It should change what you do, not just how you do it.”– Martin Movassate, founder and CEO at Heap Analytics
Embedded analytics directly integrates business intelligence (BI) capabilities and data visualization into the existing software application user interface (UI). It delivers real-time reporting to users bringing insights directly in context, so they can be promptly acted upon. Embedded analytics capabilities can be used in many different industries, such as healthcare, manufacturing, telecommunications, retail, and more, allowing businesses to collect and analyze data for various purposes. Moreover, embedded analytics provide up-to-date data in the simplest way possible so that any user can understand it. That means that data analytics is no longer solely in the hands of data analysts and ITs, but in everyone’s hands, from marketers and sales professionals to human resources managers and accountants, and even executives and everyone in between.
How Embedded Analytics Differ From Traditional BI?
Business intelligence refers to the process of taking data points and converting them into resources that can be used to make intelligent business decisions. Processes that are part of business intelligence can include collecting, storing, and retrieving data, creating reports based on that data, and making decisions backed by data.
Embedded analytics is very much the same but differs in the collection process.
Traditional BI is an independent set of systems that pull data together from various different sources. Whereas embedded analytics is software that collects tightly integrated capabilities into all types of different systems to bring insights into context.
With traditional BI solutions, you’re forced to leave your workflow and switch between applications to find the key insights that you need. In contrast, embedded analytics is embedded into applications for a better analytics experience – it allows users to combine insights and action in a standalone application without interrupting their workflow.
Why Should You Care About Embedded Analytics?
‘’87% of application providers say that embedded analytics is important to their users.’’ – Gartner
A while back, businesses have been using BI tools to transform raw data into meaningful business insights. And while it was working well, the need for embedded analytics and the buzz around it continues to increase every year. That is because to be able to extract the real value of businesses’ data users had to put their work on hold, so they could use different applications for data analysis. And that is why you should care about embedded analytics – it brings the power of data to all users so that they can make quicker and data-driven decisions without interrupting their workflow.
In other words, when using traditional BI, users are forced to switch between different apps to gain insights and take action, resulting in frustration, wasted time, and decreased efficiency. A December 2016 report from Nucleus Research found that using BI tools, which require toggling between applications, can take up as much as 1-2 hours of an employee’s time each week. Whereas embedded analytics users use only one application, which saves time, increases productivity, and delivers a better analytics experience.
What are the Benefits of Embedded Analytics?
“The core advantage of data is that it tells you something about the world that you didn’t know before.” – Hilary Mason, data scientist and founder of Fast Forward Labs
The value of embedded analytics is tremendous for everyone – it helps end users explore data and uncover insights without the help of data analytics experts and ITs while supporting product leaders and business owners to provide the best possible experience to customers.
And while the embedded analytics benefits are endless, we consider that these advantages are the most outstanding:
Increased productivity
Cultivate data-driven decision making
Competitive advantage
Increased revenue
Seamless user experience
Increased productivity
When using embedded analytics, users look at key business data in context, which removes the need to bounce between multiple different apps to find the insights they need. Therefore, when users don’t need to switch from business applications to analytics tools, they can spend more time and focus on essential tasks. Plus, seeing data being represented in beautiful visualizations also drives perceptions.
Cultivate data-driven decision making
Embedded analytics provide insights to users, but on the other side, it also provides useful insights to your customers. Presenting accurate and up-to-date data enables analytical thinking that could ultimately drive innovative ideas and improved products.
Contextual analytics enables your users to make better, faster decisions that are based on the information available at that moment or visible on the specific screen they are viewing. When people can better understand the impact of their decisions, they tend to feel more confident in making decisions.
Competitive advantage
One of the biggest benefits of embedded analytics is the competitive edge that it provides both software providers and end-users, including:
Modern app experience when your users experience in-application access to data or dashboard creation.
A deeper understanding of markets and customers when you can spot trends in your data, staying a step ahead of your competitors.
Users spend more time in your app because embedded analytics provides more data points to your users without the need for them to go to another source.
The app becomes stickier as you collect more data about your users. Users become less likely to switch to another app because your app contains information collected over time that is useful for them. This, in turn, increases customer satisfaction for your users.
Increased revenue
As per research published in AnalyticsWeek, of the 500 project managers, software developers, engineers, and executives surveyed, 96% said that embedded analytics contributes to their overall revenue growth, and 92% reported an increase in competitive differentiation.
On top of that, embedded analytics tools can provide additional revenue streams. Thanks to its huge value for the business, some of the features and functionalities could become extra, and your sales team could upsell them to new and already existing customers.
Seamless user experience
With embedded analytics, you can customize everything to match your brand theme, leading to better recognition from your customers, building creditability, and ultimately customer loyalty. Users won’t get distracted or even notice differences in your application but instead focus on the value of their data.
Should you Buy or Build an Embedded Analytics Solution?
Most organizations decide to buy an already established embedded analytics solution to integrate with their existing software. One of the primary reasons why this is the preferred option is that buying it instead of building it saves you both time and money. It also allows you to free up your developers’ resources and time so that they can focus on your core competency and what your business was initially designed for. But depending on your business needs, resources, and budget, there are pros and cons to both decisions – let’s explore them:
Should you build?
👍 Small, fast projects
Building your own analytics features in-house can be the best option when working on small projects with limited sets of requirements — especially if the development team in question has a relevant skill set and previous experience in developing embedded analytics and data visualization solutions.
👍 Total control
One of the most convincing arguments for the building is that it lets product managers remain fully in control over every aspect of their application: not just its functionality but its look and feel as well. By keeping all aspects of development in-house, product teams can control branding, user experience, and functionality.
👎 Development & maintenance
Building and maintaining a complete embedded analytics platform from scratch is not an easy task. It involves deep data analytics understanding and lots of work. To build your product, you must invest time and money in training a development team that may lack previous embedded analytics experience.
👎 Cost
A significant cost is associated with building embedded analytics, which takes seven months to complete on average. The estimated average cost is as much as $350k (based on average U.S. salaries). This includes:
4 software developers for 7 months
1 QA professional for 7 months
2 UX/UI designers for 6 months
1 data scientist for 1-month
In comparison, the standard price for an embedded solution starts at anywhere from $30K to $75K per year.
Should you buy?
👍 Focus on core product
The main disadvantage of the “build” approach is that developers must switch their focus away from working on the core product to create complex embedded analytics features. Buying saves time and money over training a development team and eliminates the need for training where internal resources are simply not available.
👍 Maintenance
Anything built in-house will have to be supported in-house. With the buy option, support will be provided by the third party, via the cloud, and ISVs will not have to allocate resources to fixing issues if and when they occur. As much as 90% of the cost of software during its lifetime is tied to keeping it up and running. Maintenance costs can be significant.
👍 Faster time to market
With average build-it-yourself times taking seven months or more, many product teams decide to buy a bolt-on analytics solution due to the need to release a product as quickly as possible. In a fiercely competitive SaaS market, and with CEOs demanding quick turnaround, buying a pre-built, off-the-shelf solution drastically improves time to market.
👍 ROI
Analytics return $13.01 for every dollar spent, according to Nucleus Research. That’s a 13:1 of embedded analytics ROI for you and for your customers when you offer embedded analytics in your SaaS solution.
👍 Maximum security guarantees
Embedded analytics providers must comply with high data security standards, the quality of which is assessed by SSL security certificates.
👎 Depending on the solution provider, you may be limited to basic dashboards and reports and have limited customization options. With this in mind, make sure to ask embedded analytics vendors the right questions to find out what you’ll get for the price they’re asking.
The 8 Must-Have Embedded Analytics Capabilities
The best embedded analytics solutions offer a lot more than just data visualizations. Here are the 8 must-have capabilities that every embedded analytics software should have:
Simple & beautiful
Self-service features
Data visualizations
Dashboard linking
Rich data analysis
Match the look & feel
API-driven VS URL Parameters
Modern architecture
1. Simple and beautiful
Most data analytics tools are so complex that users need to spend weeks and more to get used to them and learn how to use them so they can benefit from their features and capabilities. That’s why choosing a simple embedded analytics solution must be a priority for you – simple in the meaning that it provides an intuitive drag-and-drop interface so that users can get a positive outcome out of it.
And it should be beautiful, too – you’re going to embed this tool into your product and provide it to your users, after all, so you have to make sure that they’ll love it.
2. Self-service features
All your users are different. Each has a different use case for using analytics. Each has a different level of sophistication when it comes to analytics. Don’t limit experienced users- and don’t overwhelm beginners. The embedded analytics self-service features such as drag-and-drop capabilities, intuitive search, and navigation, allow your non-technical staff and departments to analyze data and create reports independently.
These are two primary things that you should be looking for when it comes down to self-service features:
Offer easy-to-use dashboards and visualization for your basic users.
Enable more editing features & customization for your power users.
3. Data visualizations
Data visualization refers to a range of chart types, and the best embedded analytics solutions let you choose from many pre-built templates. These range from a column, doughnut, and funnel to bubble, scatter, or sparkline charts, to more advanced ones such as treemap or geospatial mapping. Users can also combine these various visualizations to make a beautifully integrated dashboard.
4. Dashboard linking
Dashboard linking allows you to connect the visualizations in a dashboard with other dashboards or URLs. Imagine you want to provide more details on the information displayed in a visualization – you can use a whole new dashboard to do so. This can be very useful in Company 360 dashboards, for example, where you will be able to establish top-down analysis paths, where you go from a high-level overview of the reality of a business to more detailed views with the specifics.
5. Rich data analysis
Don’t settle for just visualizing data. Gain deeper insights without the need to be a data scientist!
Statistical functions – In terms of data analytics, statistics is the use of mathematics to perform technical analysis of data. A basic visualization such as a pie chart can give you some high-level information, but with statistics, you get to operate on the data in a much more data-driven and targeted way. Here are some of the key statistical functions:
Outliers detection – lets users easily detect points in their data that are anomalies and differ from much of a data set.
Time series forecasting – using the time series forecasting statistical function, users can make predictions on future values based on historical data and trends.
Linear regression – lets users visually see trends in their data by finding the relationship between two variables and seeing a linear approximation of the data – including future trends.
Drill down – The drill down takes a user from general overviews to a more detailed analysis with a single click.
AI features – With the help of machine learning algorithms, AI can automatically analyze data and reveal patterns, trends, and insights that can be used by users to make better fact-based decisions. AI makes data easy to understand by using NLG (Natural Language Generation).
Rich data analysis allows you to better understand and predict customer behavior and answer specific questions about your market.
6. Match the look & feel
It is disruptive to the end-users when the analytics they are being provided within an application do not look like they belong. Like they were slapped together without caring how it looks. With white-label embedded analytics capability, users won’t get distracted or even notice differences in your application but instead focus on the value of data. White labeling capabilities allow you to customize all UX elements (theming & styling, roundness vs squareness, dialogs, etc.) to match your brand experience.
7. API-driven VS URL parameters
Use a real SDK that’s made for developers. With it, you aren’t forced to simply embed iframes in your application, and you aren’t forced to configure dashboards with a parameterized URL. Use real code with real objects and real properties.
API-Driven approach to configuring dashboards.
Docs, Samples for .NET, React, jQuery, and more.
8. Modern architecture
The developer experience can make or break an embedded analytics implementation. Your BI vendor needs to keep pace with modern technology to make it simple for you.
Native SDKs that utilize the specific features of each platform and provide a superior user experience.
Robust APIs for dashboard rendering, dashboard creation, deep linking in dashboards, and custom UI for data source acquisition.
Modern API design with multi-channel distribution capabilities.
Introducing Reveal Embedded
Reveal embedded analytics solution provides organizations with the most powerful, flexible, and predictably priced analytics tools on the market. Reveal provides developers with a wide range of highly customizable and easy-to-use embedded analytics tools and data visualizations, which end users can immediately understand. These tools make your app stickier and allow you to differentiate yourself from competitors.
Reveal offers one single, simple, and affordable price point that enables you to reach unlimited users per application. Our pricing structure is both affordable and transparent, which means you can predict exactly what you will be paying and therefore calculate ROI better. We believe in collaborating closely with our clients to ensure that their users’ needs are met at all stages.
Our app support offers a range of ongoing support services with no additional costs, in conjunction with a friendly, 24-hour community that can answer any question on our forums. What’s more, transparency is a key value for our business, and we never collect your customers’ data. Want to learn more? Request a demo and see how easy it is to take action.
About the Author
Bilyana Petrova
Bilyana is an Embedded Analytics Content Specialist at Reveal. From research to creative writing, she's on a mission to make boring business blogs useful and actionable. When she's not at work, you can hardly find her as she loves discovering new destinations around the world, summiting mountain peaks, and playing with her adorable Siberian Laika.
Your Privacy Matters:We use our own and third-party cookies to improve your experience on our website. By continuing to use the website, we understand that you accept their use.Cookie Policy.
We use our own and third-party cookies to improve your experience on our website. They also allow us to analyze user behavior in order to constantly improve the website for you. Please review our Cookie Policy and cookie settings below.
When you visit any website, it may store or retrieve information on your browser, mostly in the form of cookies. This information might be about you, your preferences, or your device and is mostly used to make the site work as you expect it to. The information does not usually directly identify you, but can give you a more personalized web experience. Because we respect your right to privacy, you can choose not to allow some types of cookies. However, blocking some types of cookies may impact your experience of the site and the services we are able to offer.
Your Privacy Matters: We use our own and third-party cookies to improve your experience on our website. By continuing to use the website, we understand that you accept their use. Cookie Policy.