Explore the complete guide to embedded analytics, including architecture, security, AI capabilities, implementation patterns, and evaluation criteria for modern applications.
White-Label Software and Analytics: Enhancing Your Brand
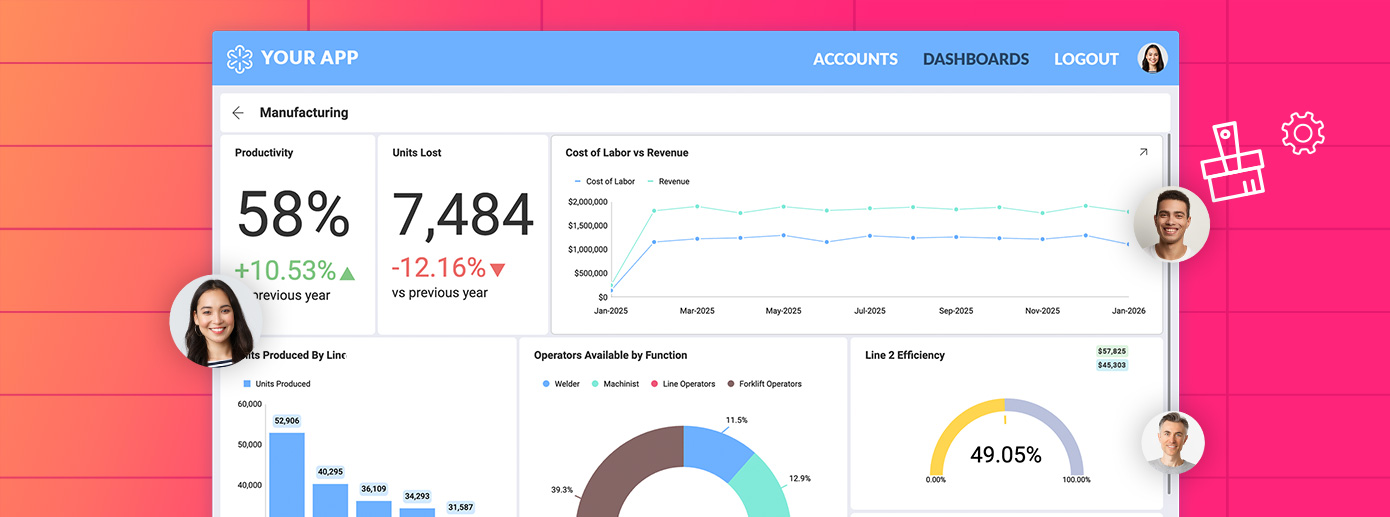
Fully branded white label dashboards offer custom personalization so that your customers can present a holistic service that is all branded to one company.
Embedded BI Features Checklist: Choose the Right Solution Tailored to Your Business Needs
Our essential features checklist has been created to guide you through a systematic evaluation process of selecting the ideal embedded BI solution. It outlines the essential features and key considerations for evaluating different analytics providers and solutions, ensuring you’re well-equipped to make an informed decision.
Here’s what is covered in our guide:
Core embedded BI features: Understand the fundamental functionalities necessary for seamless integration and needed to unlock the full potential of your data.
Developer experience and support: Evaluate the tools and support available for developers to integrate the BI solution effectively.
**Data analysis features:**Find out the top BI data analysis features for extracting actionable insights from your data.
Customization capabilities: Explore the flexibility to tailor the BI solution to your specific business needs and requirements.
Security: Ensure robust security measures are in place to protect your sensitive data and maintain compliance standards.
Usability: Consider the user-friendliness of the BI solution for effective utilization.
**Vendor support:**Explore the level of ongoing support and assistance provided by the BI solution vendor.
Pricing and licensing: Ensure the embedded BI solution investment aligns with your budget and delivers the expected ROI.
By leveraging our comprehensive checklist, you’ll be empowered to navigate the flooded marketplace of embedded BI solutions and make a well-informed decision that best suits your business needs.
In this first point of our features checklist, we will explore the fundamental capabilities that should be at the heart
of any embedded BI tool. These essential capabilities form the bedrock of a versatile and powerful analytics solution
and shouldn’t be overlooked. As you embark on your journey to select the right embedded BI vendor, pay close attention
to these essential building blocks. They will empower you to unlock the full potential of your data and create an
exceptional analytics experience.
True Embedded SDK: A true embedded software development kit (SDK) removes the need for iFrames and gives developers full control over how analytics is presented within your application. With full API support on both the client and server sides, you can integrate analytics quickly and manage everything – from deployment to the complete look and feel of the app.
Data connectivity: To ensure a robust foundation, make sure that the tool you are evaluating supports a diverse range of data sources, such as APIs, SQL databases, cloud storage, and more.
Data visualization: Look for a rich library of charts, graphs, and other data visualization tools, including geospatial visualizations and heatmaps, and the ability to create custom visualizations. The capability to create custom visualizations allows for a tailored representation of data, ensuring that insights are conveyed effectively and intuitively.
Interactive dashboards: Moving beyond static dashboards, the embedded BI tool you choose should facilitate dynamic and interactive dashboards too. Features such as drill-down and filtering are paramount, enabling users to navigate through layers of data for deeper insights.
Download PDF: Don’t have time to read the whole guide now? No worries. Download the PDF version so you can read it when it is convenient for you.
When assessing embedded BI vendors, the emphasis on the developer experience within the SDK becomes a critical factor in determining the success of your BI project’s proof-of-concept and implementation phases.
Here’s what to look for:
SDK availability: Client-side SDKs tailored for modern programming languages such as C#, JavaScript, or TypeScript are essential for achieving deeper customization and control during deployment. Equally important are server SDKs compatible with common back-end technologies like .NET Core, Node.js, and Java.
Documentation & API support: The roadmap to a seamless integration process is paved with comprehensive documentation and robust API support. Developer-centric how-to documentation, enriched with code snippets, is crucial for empowering your development team. A well-documented SDK ensures that developers can navigate the intricacies of the embedded BI solution, fostering a smooth integration process and reducing the learning curve.
Samples & training: Providing comprehensive end-to-end examples on GitHub for both client and server features, along with step-by-step video training and accompanying guides, will equip your development team with all the necessary resources to integrate the solution into your application seamlessly.
Issues, bugs & roadmap transparency: Access to GitHub for posting new issues, viewing, and commenting on existing issues, as well as accessing the roadmap and release notes, instills confidence within the development team. This access assures them that the vendor maintains transparency regarding their processes and the current state of the product.
Regarding self-service embedded analytics, the priority for your customers and end-users is the “ease of use”. Your customers expect a simple experience to create visualizations and dashboards, view underlying data, and draw conclusions without specialized training or IT involvement. Recognizing this demand, the top embedded BI data analysis features become pivotal components in facilitating a seamless and intuitive analytics experience for your users.
Ad-hoc data dashboard filtering & exploration: Enabling ad-hoc data dashboard filtering and exploration grants users the flexibility to dynamically adjust and refine their data views on the fly.
Time-series drill-down: The time-series drill-down data analysis feature allows users to seamlessly navigate through temporal data, uncovering trends and patterns at different granularities.
Hierarchical drill-drown: With hierarchical drill-down, users can delve into hierarchies within their datasets, gaining a comprehensive understanding of how data elements are structured and interconnected.
Data joining & blending: The ability to join and blend disparate datasets ensures a holistic analysis. It allows users to bring multiple sources together into one visualization for a deeper, side-by-side view.
Dashboard linking: The purpose of the dashboard linking feature is to simplify the data analysis process by providing a seamless and cohesive user experience, allowing users to navigate relevant dashboards without leaving the software application they are already using.
Calculated & custom fields – Another must-have embedded BI feature that allows users to effortlessly extract and manipulate data from text columns, streamlining the data analysis process.
Tooltips with data values & summaries: Tooltips enriched with data values and summaries provide users with immediate context. Users can hover over visual elements to gain a quick understanding of the underlying data.
Annotating & exporting visualizations as images: Annotations and the capability to export visualizations as images enhance the communicative power of data. Users can add context to visual elements and share them easily, supporting collaboration and knowledge-sharing.
Statistical functions like Regression, Forecasting & Outliers: Integrating statistical functions such as regression, forecasting, and outlier detection allows users to perform advanced analyses, unlocking deeper insights and predictive capabilities.
Exporting: The ability to export dashboards and visualizations allows for easy sharing and collaboration, enabling users to share insights with stakeholders who may not have direct access to the analytics platform. Popular supported dashboard export formats to look for include Excel, Image, PowerPoint, PDF, and JSON.
Customizing the user experience enhances engagement, satisfaction, and the overall competitiveness of your solution. It’s crucial that any embedded BI solution not only replicates the look and feel of your application but also provides the capability to tailor the user experience based on individual user needs and profiles.
Customization capabilities you should consider include:
API-driven approach: Adopting an API-driven approach, both on the client and server sides, is
instrumental in allowing users to show or hide available features. This customization capability empowers
administrators and end-users alike, enabling them to curate their dashboard interfaces based on their specific
analytical requirements.
Built-in themes supporting light and dark models: The inclusion of built-in themes that support
both light and dark models caters to the diverse preferences of your user base. Users can select a theme that
aligns with their visual comfort, creating a personalized environment for analysis.
CSS or property-based theming and branding options: Empowering users with CSS or property-based
theming and branding options signifies a deeper level of customization. This capability allows for the creation
of custom themes that go beyond color schemes.
Ability to add custom buttons on visualizations with custom actions: Users can augment visual
elements with buttons that trigger custom actions, enhancing the interactivity of the BI solution. This feature
allows for a more dynamic and personalized exploration of data based on user-defined actions.
Custom Visualizations: The ability to create custom visualizations comes with plenty of
benefits. It provides tailored data representation, enables the creation of reports without compromising data
accuracy or clarity, and enhances the user experience by enabling more effective interaction with the data,
among others. But that’s not all. The embedded BI providers offering the ability to create custom visualizations
provide their users with the freedom to take control of the chart types available within their dashboards,
allowing them to not only create new unique visualizations but to also update existing ones to better serve
them, and even remove those that aren’t needed.
Override existing default events in the API: Granting users the ability to override existing
default events in the API ensures a high degree of customization. This feature allows users to redefine how
certain events are triggered, providing them with the flexibility to tailor the behavior of the embedded BI
solution according to their specific workflow and preferences.
Security stands as a paramount concern in the implementation of any embedded BI solution. Safeguarding sensitive data and ensuring authorized access are crucial components in building trust with users.
Here are key considerations and features to prioritize when evaluating the security aspects of an embedded BI solution:
Datasource-level Authentication Features:Ensuring robust authentication mechanisms at the data source level is foundational for securing data integrity. The
embedded BI solution should support various authentication methods, including:
Username and password: Implementing secure credential-based access.
Tokens: Leveraging token-based authentication for enhanced security.
OAuth: Facilitating secure, delegated access to data sources through industry-standard authentication protocols.
These authentication features ensure that only authorized individuals can access and interact with the data sources, mitigating the risk of unauthorized data exposure.
Role-based Access APIs: Role-based access control is an essential security measure that dictates what actions users are allowed to perform within the BI solution based on their roles or responsibilities. APIs supporting role-based access control enable administrators to define and manage user roles effectively. This ensures that each user has access only to the data and functionalities necessary for their specific role, reducing the risk of unauthorized data manipulation or viewing.
APIs for Simplifying User Context Passing: APIs that simplify this process ensure that user-related information is securely transmitted between the client-side and server-side components of the embedded BI solution. This includes passing user identity, permissions, and other relevant context information.
In the world of embedded BI, usability is the compass that guides your users through their data journey. The ease with
which users can navigate, analyze, and interpret data is a fundamental aspect of a successful embedded BI solution. Two
crucial aspects that define the usability of an embedded BI solution are self-service capabilities and the learning
curve for users, particularly non-technical ones.
Self-service: At the heart of a user-friendly embedded BI solution lies the principle of
self-service. The embedded BI tool shouldn’t limit experienced users and overwhelm beginners. Look for a
self-service tool that provides a robust What You See Is What You Get (WYSIWYG) drag-and-drop visualization
editor that ensures that users, regardless of their technical proficiency, can intuitively design and customize
visualizations. This feature ensures agility in adapting to evolving analytical needs within the organizations
and it is of utmost importance that the embedded BI tool you choose to invest in has it.
Dashboard Templates: Look for a tool that provides pre-built dashboard templates to simplify
the creation of dashboards and reports for users. Such pre-built elements act as building blocks, allowing users
to quickly assemble reports and dashboards, reducing the time and effort required for development.
Learning curve: The degree of complexity in understanding and utilizing the tool can
significantly impact its adoption across diverse user roles within an organization. Comprehensive onboarding
resources, including documentation, tutorials, and training materials, play a pivotal role in easing the
adoption process. These resources provide users with the necessary guidance and support to quickly familiarize
themselves with the embedded BI solution, thereby accelerating the integration into their workflow.
Vendor Support
Choosing the right embedded BI vendor is not only about the tool’s features but also about the support ecosystem it
offers. Make sure that the vendor will provide you with the resources you need to overcome any technical challenges and
more.
Proof of Concept: Proof of Concept (PoC) is a crucial phase of a vendor support evaluation
serving as a testing ground for you to verify how effective the product will be in your unique context. During
that PoC phase, it is essential to ensure that the BI solution seamlessly integrates with your existing
infrastructure, addresses your analytics needs, and aligns with your project requirements.
Customer support: A combination of live and self-service support options, and experienced
professionals must be available to help you with any technical questions. The availability of support channels,
including real-time chat, email, and escalation paths, guarantees that assistance is readily available when
needed. This level of support is crucial during critical phases of development, enabling your team to overcome
hurdles promptly and ensuring the project stays on track.
Community: An active user community can help you share best practices and experiences with
others so anyone can benefit and help each other grow and succeed.
Understanding the pricing and licensing aspects is crucial for a successful partnership with your chosen vendor. Ensure
the embedded BI solution investment aligns with your budget and delivers the expected return on investment (ROI).
Pricing model: The pricing model is a fundamental aspect that directly impacts the financial
feasibility of adopting an embedded BI solution. It’s essential to assess whether the pricing model aligns with
your budget and ROI expectations. Understanding the pricing structure and evaluating how it scales with your
organization’s growth is crucial. Consider whether the pricing model is transparent, allowing you to accurately
project costs and assess the impact on your overall budget.
Licensing: Confirming that the licensing model aligns with your deployment requirements is a
key consideration. Different embedded BI solutions may offer various licensing options, so it is important to
choose a licensing model that not only suits your current deployment needs but also accommodates potential
scalability in the future.
Free trial: The availability of a free trial is a valuable component in the decision-making
process. A free trial allows your team to test the product thoroughly before making a financial commitment.
During the trial period, you can assess the functionality, usability, and compatibility of the embedded BI
solution with your specific use cases. It also provides an opportunity to engage with the vendor’s support team,
evaluate the level of assistance available, and determine whether the solution aligns with your organization’s
goals.
The Infragistics Heritage: Introducing Reveal Embedded Analytics
Reveal Embedded Analytics enables your teams and customers to drive data insights with embedded intelligence, accelerate time to market, and transform the user experience of your apps.
Built with embedding in mind first, on today’s most modern architecture, Reveal’s powerful API removes the complexity of embedding analytics into your applications. Reveal’s native SDKs make integrating into your application seamless on any platform and tech stack, including .NET Core, Java, NodeJS, and front-end technologies such as React, Angular, WebComponent, VueJS, jQuery, MVC, and Java Frameworks like Spring, Tomcat, and Apache.
With intuitive drag-and-drop functionality, creating beautiful and informative dashboards on any device is simple. Quickly run predictive analysis and machine learning models with just a few clicks to make more educated business decisions.
Reveal embed keeps your teams focused on your app’s core value and lights up your user experience – with a simple, fixed price.
We know that you probably have a lot more questions about Reveal and whether it is a good fit for your unique business case, and we’re always happy to answer them and help further. Get in touch with Casey McGuigan at CaseyM@revealbi.io.
Learn more about Reveal, the complete embedded analytics solution:
Book a demo – See Reveal in action and learn how it can accelerate your business.
Talk to an expert – Book a call with our sales team and get answers to all your questions.
About the Author
Casey Ciniello
Casey Ciniello is a data and analytics-focused product leader at Infragistics, where she drives strategy and innovation for the Reveal embedded analytics platform and the Slingshot work management solution. With a BA in mathematics and an MBA, she brings an in-depth analytical foundation and business perspective to building products that help organizations turn complex data into actionable insights.
Casey leads the development of analytics-driven capabilities, shaping product direction through deep market analysis, user behavior insights, and evolving business intelligence trends. She works closely with customers to understand how data is used in real-world decision-making and translates those needs into intuitive, high-impact analytics experiences. Casey also serves as the Survey Lead for the annual Reveal Software Development Challenges survey, where she analyzes industry data to uncover key trends in analytics, AI, and modern development practices. Her insights and thought leadership have been featured in Dataversity, RT Insights, SaaSXtra, SD Times, Solutions Review, TechStrong IT, App Developer Magazine, Beta News, Integration Developer News, and UX Planet. She is a frequent webinar presenter on modern embedded analytics, machine learning, data visualizations, and scaling SaaS analytics. Casey joined Infragistics in 2013.
Your Privacy Matters:We use our own and third-party cookies to improve your experience on our website. By continuing to use the website, we understand that you accept their use.Cookie Policy.
We use our own and third-party cookies to improve your experience on our website. They also allow us to analyze user behavior in order to constantly improve the website for you. Please review our Cookie Policy and cookie settings below.
When you visit any website, it may store or retrieve information on your browser, mostly in the form of cookies. This information might be about you, your preferences, or your device and is mostly used to make the site work as you expect it to. The information does not usually directly identify you, but can give you a more personalized web experience. Because we respect your right to privacy, you can choose not to allow some types of cookies. However, blocking some types of cookies may impact your experience of the site and the services we are able to offer.
Your Privacy Matters: We use our own and third-party cookies to improve your experience on our website. By continuing to use the website, we understand that you accept their use. Cookie Policy.