
Scriptly Helps Pharmacies Identify Trends in Real Time with Reveal
Explore the complete guide to embedded analytics, including architecture, security, AI capabilities, implementation patterns, and evaluation criteria for modern applications.
Read NowFully branded white label dashboards offer custom personalization so that your customers can present a holistic service that is all branded to one company.
Read NowReveal business intelligence blog gives you the latest embedded analytics trends, how-tos, best practices, and product news.
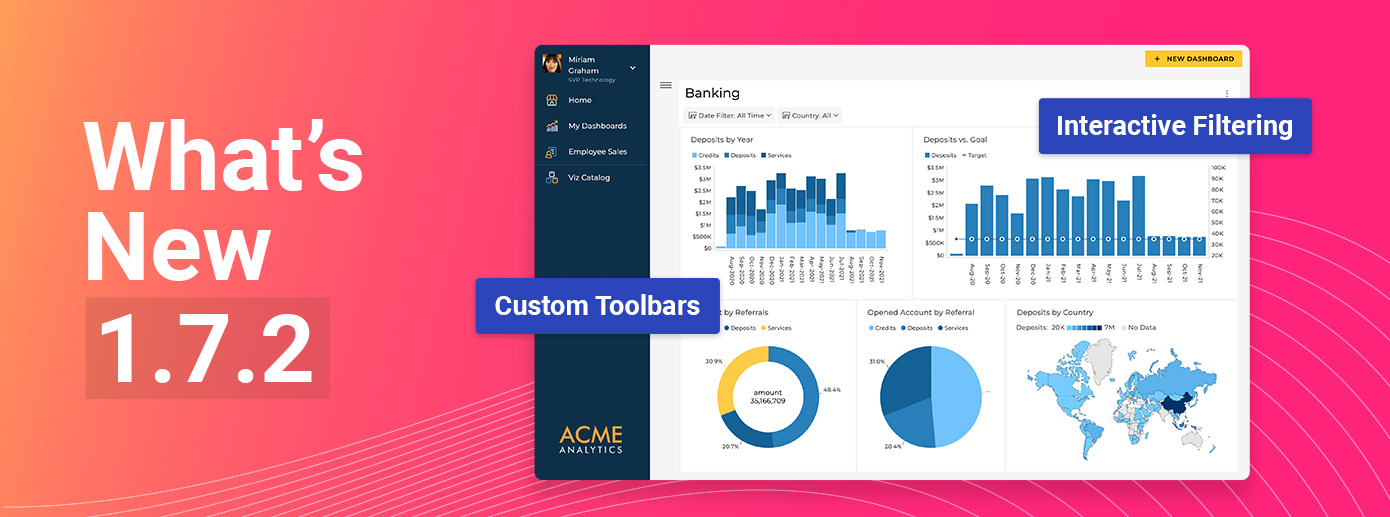
Reveal Version 1.7.2 is Live! Gain full control with powerful customization tools and seamless data interaction to build tailored, intuitive analytics experiences.
Continue reading...
Find out how to integrate embedded analytics into Angular applications with a .NET Core backend, for better decision-making capabilities that drive engagement and ROI.
Continue reading...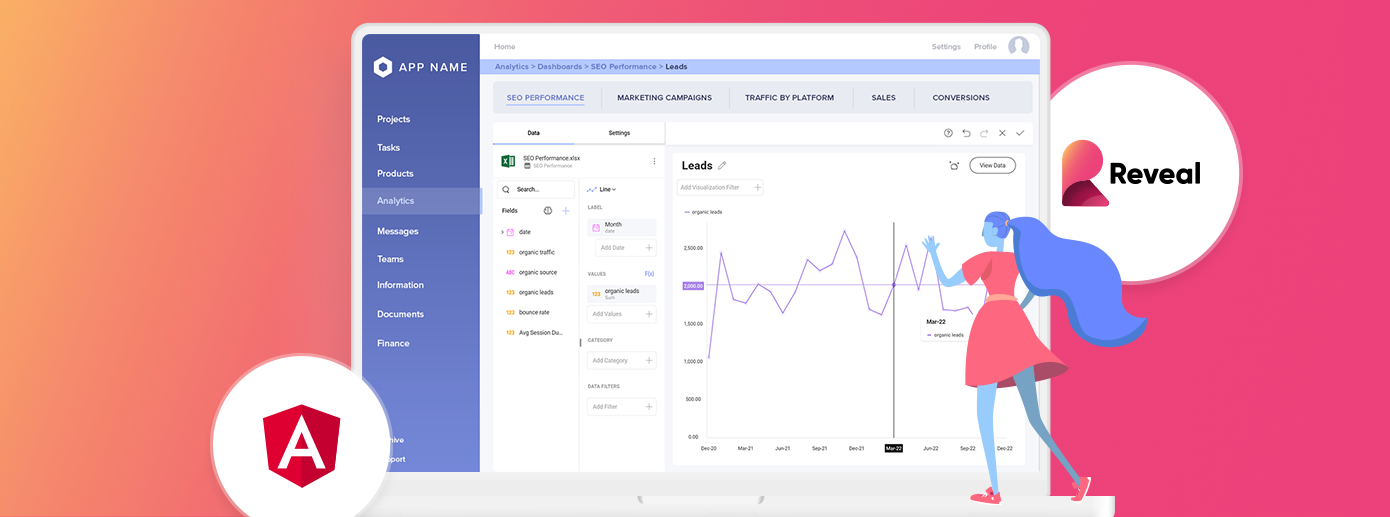
Learn how using incorporating angular BI, can help you streamline workflows, manage resources and optimize performance for your apps.
Continue reading...
In this guide, we’ll cover the key 2025 requirements for selecting an embedded analytics platform, how it benefits product analytics, and the current available implementation methods.
Continue reading...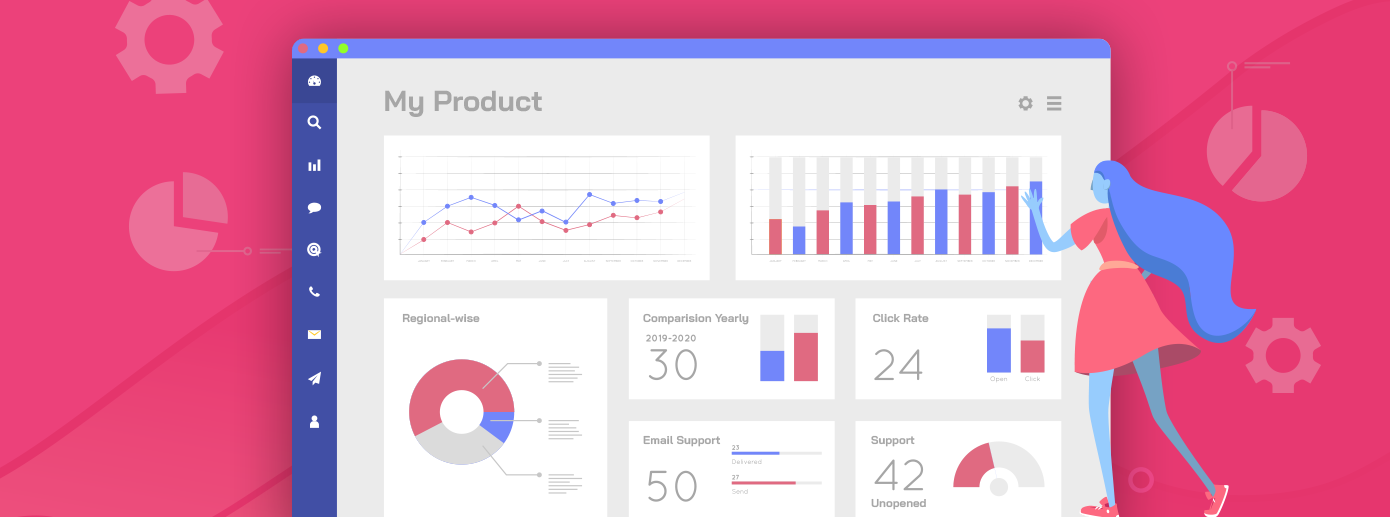
Learn how to harness data-driven insights to enhance user engagement, all while exploring the synergy between product analytics and embedded analytics for 2025.
Continue reading...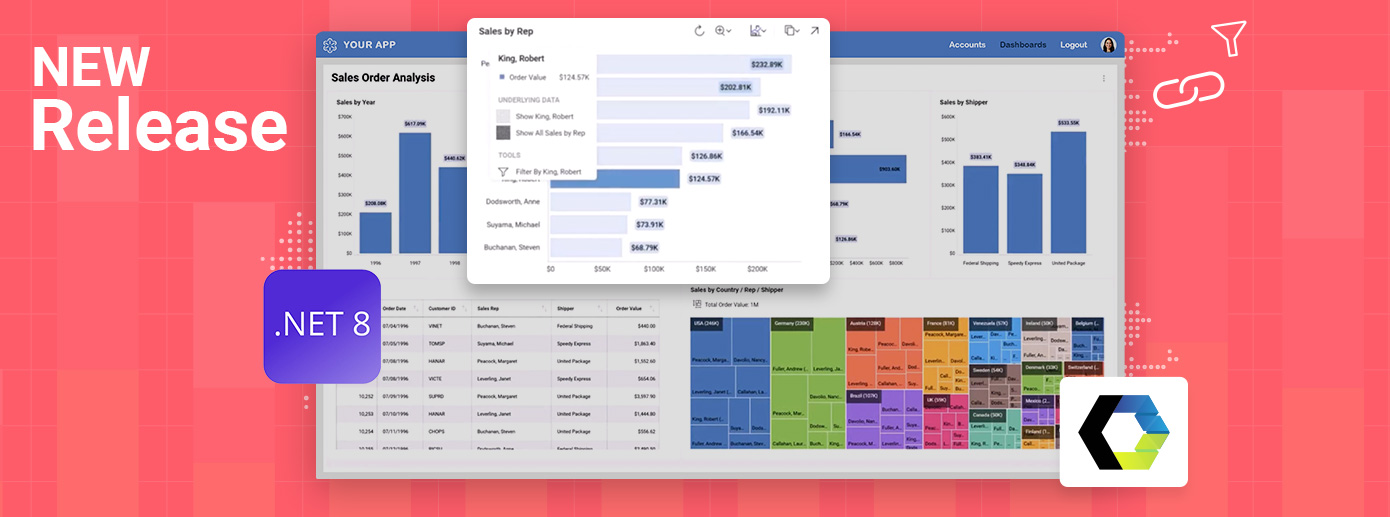
Reveal is excited to launch new features and updates designed to enhance your development experience and deliver more flexibility and control for embedding analytics.
Continue reading...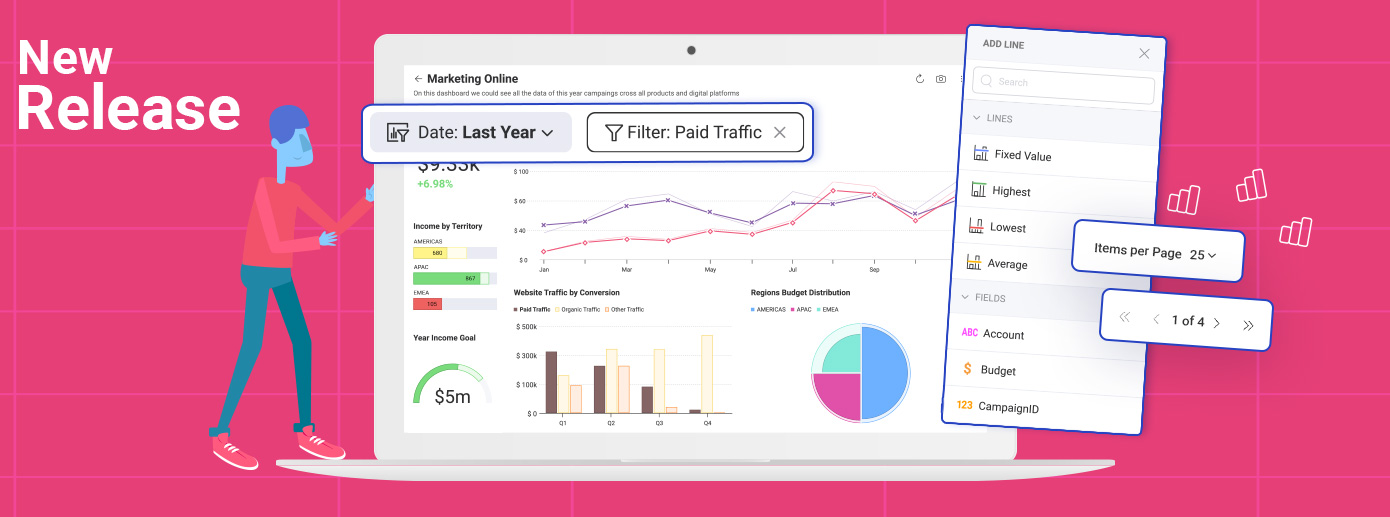
We’re excited to announce the latest Reveal release, packed with powerful new features designed to enhance your analytics capabilities while keeping you informed of critical breaking changes that may impact your applications.
Continue reading...
Learn how AI turns natural language into insights and how conversational analytics boost Saas and ISV products adoption and monetization
Continue reading...
Discover 5 effective strategies to overcome integration challenges in embedded analytics and enhance your analytics integration for seamless performance. Find out more.
Continue reading...
Explore the implications of limited customization in embedded analytics and why it’s a critical issue for CTOs, product managers, and development teams. Read more!
Continue reading...
