Os usuários esperam respostas imediatas em todas as ferramentas que utilizam. A maioria das ferramentas de IA pode responder em menos de 3 segundos; seus painéis também devem. Sem hesitação. Sem interrupções em seu fluxo de trabalho acelerado. Quando um painel lento os faz esperar, seu produto parece irrelevante, desatualizado e inútil.
Você pode construir recursos avançados e adicionar capacidades de IA. Nada disso importa se um BI lento quebra o ritmo. Quando a análise incorporada está dentro do seu produto, os usuários se adaptam. Eles clicam menos. Eles exportam dados. Eles param de tratar a análise como parte de seu fluxo de trabalho diário. Com o tempo, essa mudança afeta a adoção e a forma como os clientes avaliam sua plataforma.
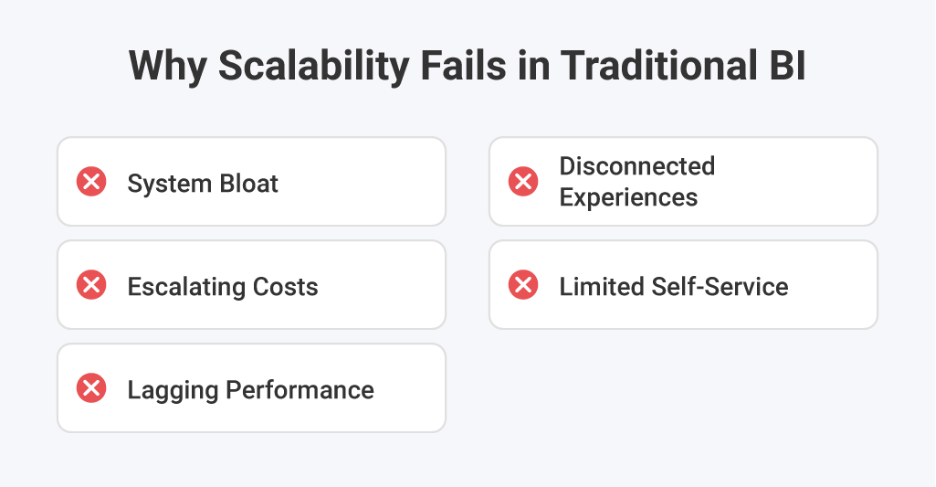
Por Que Painéis Lentos Matam a Adoção Silenciosamente
A análise de produtos frequentemente segue uma curva previsível. Um novo recurso de relatórios é lançado, o uso dispara, e depois o engajamento diminui com o tempo. As equipes assumem que o interesse está diminuindo. Em muitos casos, um painel lento causa essa queda.
Os usuários raramente reclamam sobre BI lento. Eles ajustam seu comportamento em vez disso. O primeiro impacto aparece na profundidade da interação. Os usuários aplicam menos filtros. Eles evitam drilldowns de múltiplas etapas. Eles param de alternar entre painéis durante uma sessão. Quando o tempo de carregamento do painel excede as expectativas, a exploração diminui. O tempo de carregamento do painel se estica por alguns segundos a mais.
Essa mudança cria um impacto mensurável no produto:
- Redução da profundidade do recurso, os usuários interagem com menos capacidades de análise
- Qualidade de sessão mais baixa, os painéis se tornam visualizações passivas em vez de ferramentas de decisão
- Fragmentação do fluxo de trabalho, os usuários movem a análise para fora do seu produto
- Declínio do valor estratégico da análise incorporada dentro da sua plataforma
BI lento raramente quebra da noite para o dia. Ele reduz gradualmente o papel que a análise desempenha em seu produto. Uma vez que a adoção de análise enfraquece, as consequências financeiras seguem.
O Custo Real de Negócio do BI Lento
Você pode tolerar atrito menor em seu produto, mas não pode ignorar sinais de receita. BI lento não aparece como uma falha do sistema. Ele aparece como expansão em declínio, ciclos de vendas mais longos e conversas de renovação mais difíceis. Um painel lento reduz silenciosamente o valor que os clientes atribuem à sua análise.
As equipes de suporte e engenharia muitas vezes sentem a pressão primeiro. Os clientes relatam que os painéis “parecem estranhos” ou “levam muito tempo”. Os engenheiros gastam ciclos ajustando consultas em vez de construir recursos de roadmap. O desempenho do BI se torna uma tarefa reativa em vez de uma vantagem estratégica.
O impacto nos negócios se acumula com o tempo:
- Risco de churn mais alto quando a análise não consegue suportar decisões diárias
- Conversão mais baixa em níveis premium ligados a relatórios avançados
- Conversas de expansão mais lentas em torno de recursos avançados de análise
- Esforço de engenharia aumentado gasto estabilizando o BI lento
A análise frequentemente desempenha um papel central em retenção de clientes com análise incorporada e estratégias de monetização de dados de longo prazo. BI lento carrega um risco financeiro mensurável. Por exemplo, pesquisas mostram que até um atraso de um segundo no tempo de carregamento pode cortar as conversões em até 7%, e atrasos mais longos podem levar as taxas de rejeição a níveis tão altos quanto 90%. Organizações que adotam análise em tempo real veem até 15% de crescimento de receita e 23% de eficiência em comparação com aquelas que dependem de insights atrasados. Quando o BI lento enfraquece a confiança, ele enfraquece o apalancamento de receita e a velocidade de decisão. Para mitigar esse risco, você precisa entender onde o desempenho do painel realmente falha.
Onde o Tempo de Carregamento do Painel e o Desempenho do BI Falham
As equipes culpam o tamanho dos dados quando os painéis ficam lentos. Grandes conjuntos de dados realmente criam pressão, mas raramente causam BI lento por conta própria. As decisões de arquitetura geralmente criam as primeiras rachaduras. Um painel lento muitas vezes reflete como a análise foi integrada, e não o quanto de dados você armazena.
Muitos produtos tratam relatórios como um complemento. As equipes adicionam análise a sistemas existentes sem redesenhar o fluxo de consultas. Esses desafios de integração de análise incorporada criam gargalos ocultos. Quando o tempo de carregamento do painel aumenta, a causa raiz geralmente está no design da carga de trabalho.
Pontos de falha comuns incluem:
- Nenhuma camada de cache inteligente para reduzir consultas repetidas
- Mau manuseio da concorrência do usuário sob carga máxima
- Planos de execução de consultas ineficientes em bancos de dados compartilhados
- Cargas de trabalho mistas em tempo real e históricas sem isolamento
A complexidade aumenta quando você conecta múltiplas fontes de dados. Cada sistema adicional introduz latência e sobrecarga de sincronização. Sem uma arquitetura de análise escalável, o BI lento se torna previsível à medida que seu produto cresce.
O desempenho do BI raramente colapsa da noite para o dia. Ele se degrada gradualmente à medida que o uso se expande. Para corrigir painéis lentos, você precisa projetar para o desempenho desde o início.
O Que as Plataformas de Análise Incorporada de Alto Desempenho Fazem de Diferente
Quando as equipes diagnosticam um lançamento de BI lento, o padrão parece familiar. Alguém adiciona índices, aumenta a memória e ajusta alguns painéis. Ajuda por uma semana. Então o uso cresce, e o painel lento retorna. As plataformas de alto desempenho evitam esse ciclo por meio de escolhas de design que você pode verificar.
Separar cargas de trabalho para que as consultas não briguem
Plataformas rápidas isolam consultas interativas de trabalhos em segundo plano. Elas não deixam que atualizações agendadas compitam com cliques de usuários ao vivo. Elas separam cargas de trabalho em tempo real e históricas. Isso protege o desempenho do BI durante os horários de pico. Se cada solicitação atinge o mesmo caminho, o tempo de carregamento do painel se torna imprevisível à medida que o tráfego cresce.
Cache deliberadamente, e cache na camada certa
O cache só funciona quando corresponde ao comportamento do usuário. A maioria dos usuários SaaS faz perguntas semelhantes em diferentes funções e contas. Plataformas de alto desempenho armazenam em cache resultados de consultas repetidas e pré-agregam métricas comuns. Isso reduz a pressão no banco de dados e estabiliza o tempo de carregamento do painel. Também impede que o BI lento reapareça durante picos de tráfego.
Padrões eficazes incluem:
- Pré-agregar KPIs comuns para visualizações de tendência
- Armazenar em cache consultas compartilhadas para painéis de alto tráfego
- Carregar visuais críticos antes dos componentes secundários
Projetar para concorrência, não para velocidade de usuário único
Muitos testes de desempenho assumem um usuário ativo. Produtos reais raramente operam dessa forma. De acordo com o survey de 2026 da Reveal, 76% das empresas já usam análise incorporada. À medida que a análise se torna central nos fluxos de trabalho diários, o uso concorrente não é mais ocasional. Seus clientes abrem painéis ao mesmo tempo, especialmente durante os ciclos de relatórios.
Plataformas de alto desempenho planejam para concorrência e isolamento de inquilinos. Elas controlam o query fan-out e limitam a latência no pior caso. Sem salvaguardas arquitetônicas, um pico de tráfego pode acionar um painel lento em várias contas. Projetar para concorrência protege o desempenho à medida que a adoção cresce.
Planejar para complexidade de consulta impulsionada por IA
A IA aumenta a imprevisibilidade nos fluxos de trabalho de análise. Consultas de linguagem natural podem gerar agregações complexas e lógica de filtro cruzado. Análise com IA deve responder rapidamente para manter a credibilidade. Se o sistema subjacente tiver dificuldades, o BI lento se torna mais visível. A arquitetura de desempenho deve lidar com padrões de consulta variáveis sem degradar a capacidade de resposta.

Manter a marca e os visuais personalizados rápidos sob pressão.
A análise voltada para o cliente é parte da interface do seu produto. Os usuários a julgam da mesma forma que julgam a navegação ou a pesquisa. Flexibilidade de análise incorporada permite que você combine o visual e o toque do seu produto. Visualizações de dados personalizadas DIY dão a você espaço para se diferenciar. Um forte analytics white-label só entrega valor quando a velocidade permanece consistente. Se a personalização desacelera o painel, a experiência da marca sofre.
Como a Reveal Resolve o BI Lento no Nível da Arquitetura
Muitas vezes vemos equipes responder ao BI lento escalando a infraestrutura. Eles adicionam mais computação ou atualizam bancos de dados. A melhoria parece temporária. O painel lento retorna sob uso real. A causa raiz geralmente está na arquitetura, não no hardware.
Construído para casos de uso incorporados
Reveal foi projetado para análise voltada para o cliente desde o início. Ele funciona como um verdadeiro SDK dentro do seu aplicativo, não como um iFrame sobreposto. Isso reduz a sobrecarga e evita integrações frágeis. As cargas de trabalho são estruturadas para suportar ambientes multilocatário e concorrência de usuários. O BI lento frequentemente surge quando a análise é anexada. A Reveal evita esse padrão por meio de um design incorporado deliberado.
Cache Redis e estabilidade de desempenho
A Reveal usa Redis como uma camada de cache inteligente entre seus dados e seus painéis. Consultas solicitadas frequentemente não atingem o banco de dados todas as vezes. Isso protege o tempo de carregamento do painel durante o uso de pico. Também impede que um pedido pesado degrade a experiência para outros. Quando o tráfego aumenta, o Redis ajuda a absorver a pressão antes que ela desacelere o painel.
Capacidades de IA sem compromissos de desempenho
Muitas equipes adicionam recursos de IA apenas para introduzir BI lento sem querer. Consultas de linguagem natural podem gerar cargas de trabalho imprevisíveis. A análise de IA da Reveal é executada dentro da mesma arquitetura governada que o restante da plataforma. Ela gera definições de painel em vez de SQL descontrolado. Isso mantém o desempenho previsível e protege a experiência do usuário. A IA não deve criar um painel lento quando o uso aumenta.
Comprovado sob carga real de clientes
Scriptly ajuda farmácias a identificar tendências em tempo real usando a Reveal. Seus usuários dependem de painéis responsivos para monitorar padrões de prescrição. Sob uso concorrente, o desempenho deve permanecer estável. O sistema não pode tolerar BI lento durante fluxos de trabalho críticos. Este caso de uso valida uma arquitetura construída para demanda ao vivo.
Seguro e pronto para implantação por design
O desempenho não pode comprometer o controle. A Reveal alinha velocidade com segurança de análise e isolamento estrito de inquilinos. Ele suporta implantações de análise em nuvem e on-premise sem redesenhar o modelo de desempenho. O desempenho do BI permanece consistente em todos os ambientes. Um painel lento em um ambiente regulamentado carrega um risco maior, então a arquitetura deve permanecer previsível.
Desempenho sem desacelerar a entrega
A Reveal incorpora decisões de desempenho na camada da plataforma. As equipes evitam meses de ajustes reativos. Elas reduzem o tempo de lançamento no mercado porque o desempenho não exige trabalho de infraestrutura personalizado. O BI lento muitas vezes reflete dívida técnica acumulada. Com a Reveal, o desempenho é parte da fundação, não um pensamento posterior.
É assim que a arquitetura transforma o desempenho de um passivo em alavancagem. O passo final é reconhecer que a velocidade não é um recurso técnico. É uma estratégia de produto.
Desempenho É uma Estratégia de Produto
Muitas equipes tratam o desempenho do BI como uma métrica técnica. Eles monitoram tempos de resposta e carga do banco de dados. Eles atribuem o ajuste à engenharia. Na realidade, o BI lento reflete decisões de produto que moldam como os clientes julgam sua plataforma.
Os usuários comparam sua experiência com todas as outras ferramentas que utilizam. Eles não separam a análise do restante da sua interface. Um painel lento sinaliza instabilidade. Sugere que o sistema pode ter dificuldades com o crescimento. Mesmo recursos fortes perdem credibilidade quando o desempenho parece inconsistente.
Como CTO, você define as prioridades arquitetônicas. Você decide se a análise é executada como uma camada central ou como um pensamento posterior. Prevenir o BI lento exige planejar concorrência, cache e isolamento de carga de trabalho desde o início. Também exige alinhar os objetivos de desempenho com os objetivos de retenção e monetização.
Um painel lento raramente causa churn imediato. Ele muda a forma como os clientes interagem com o tempo. A análise rápida constrói confiança. Usuários confiantes dependem do seu produto para decisões. Essa dependência impulsiona a adoção, a expansão e o crescimento de longo prazo.
Aproveite o Poder dos Dados
Cresça seu negócio com dados contextuais e em tempo real.