
Scriptly Helps Pharmacies Identify Trends in Real Time with Reveal
Explore the complete guide to embedded analytics, including architecture, security, AI capabilities, implementation patterns, and evaluation criteria for modern applications.
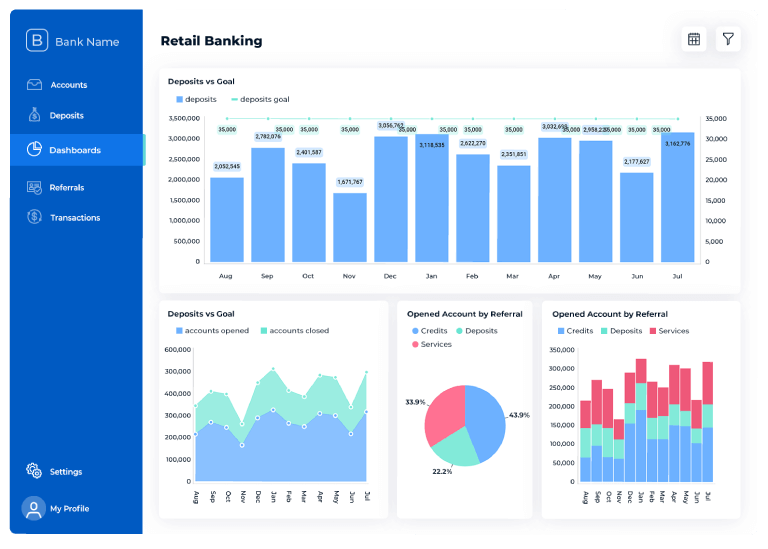
Read NowFully branded white label dashboards offer custom personalization so that your customers can present a holistic service that is all branded to one company.
Read Now대화형 분석, 거버넌스된 AI 인사이트, 그리고 엔터프라이즈급 제어 기능을 SDK를 통해 제품 내부에 완전히 임베딩할 수 있습니다.
기대하는 모든 임베디드 분석 기능 — 거버넌스된 AI 지능으로 향상되었습니다.
사용자가 자연어로 질문하고 SaaS 애플리케이션 내에서 컨텍스트 기반의 데이터 기반 답변을 받을 수 있도록 지원합니다.
Embedded AI features include:
엔터프라이즈 제어 기능을 갖춘 대화형 분석. 규제 산업에서 보안은 선택 사항이 아닙니다.
Reveal's embedded analytics features are designed to prevent:
임베디드 분석은 귀하의 제품과 경쟁하는 것이 아니라 일치해야 합니다.
Reveal offers:
Reveal은 기존 데이터 아키텍처와 통합됩니다.
Supported connections include:
완전히 사용자 정의 가능한 화이트 라벨 솔루션으로, Reveal은 분석 솔루션을 귀하의 것인 것처럼 브랜딩할 자유를 제공하여 원활한 브랜드 경험을 보장합니다.

상세 드릴다운부터 대화형 시리즈 필터링까지, Reveal은 사용자가 가치 있는 통찰력을 쉽게 발견할 수 있도록 역동적인 데이터 탐색 경험을 제공합니다.

추세를 예측하고, 이상 징후를 식별하며, 가장 필요할 때 실행 가능한 통찰력을 제공하는 힘을 활용하세요.

Reveal은 사용자가 원활하게 통합된 분석 플랫폼을 경험하도록 보장하며, 더욱 응집력 있는 사용자 경험을 제공합니다.

사용자 친화적인 대시보드는 통찰력 있는 데이터 프레젠테이션과 시각적으로 놀라운 경험을 제공하도록 설계되었습니다.

Reveal의 네이티브 SDK는 클라이언트와 서버에 대한 완전한 제어권을 부여하여, 타의 추종을 불허하는 유연성과 맞춤 설정을 가능하게 합니다.

완전히 사용자 정의 가능한 화이트 라벨 솔루션으로, Reveal은 분석 솔루션을 귀하의 것인 것처럼 브랜딩할 자유를 제공하여 원활한 브랜드 경험을 보장합니다. 특정 요구 사항에 맞게 조정할 수 있는 유연성을 제공하며, 포함된 API를 통해 분석을 원활하게 통합하고 확장할 수 있습니다.

상세 드릴다운부터 대화형 시리즈 필터링까지, Reveal은 사용자가 가치 있는 통찰력을 쉽게 발견할 수 있도록 역동적인 데이터 탐색 경험을 제공합니다. 데이터에 깊이 파고들어 가치 있는 정보를 추출하고, 자신 있게 데이터 기반 결정을 내리세요.

Reveal은 예측 분석 기능을 제공하여 기존의 데이터 분석을 뛰어넘습니다. 추세를 예측하고, 이상 징후를 식별하며, 가장 필요할 때 실행 가능한 통찰력을 제공하는 힘을 활용하세요.

iFrame의 복잡성은 이제 그만. Reveal은 사용자가 원활하게 통합된 분석 플랫폼을 경험하도록 보장하여, 번거로움 없는 경험과 더욱 응집력 있는 사용자 경험을 제공합니다.

사용자 친화적인 대시보드는 사용하기 쉽다는 점이 돋보입니다. 하지만 기능적일 뿐만 아니라, 통찰력 있는 데이터 프레젠테이션과 시각적으로 놀라운 경험을 제공하여 깊은 인상을 남기도록 설계되었습니다.

Reveal의 네이티브 SDK는 클라이언트와 서버 모두에 힘을 실어주어, 사용자에게 완전한 제어권을 부여합니다. 이 접근 방식은 타의 추종을 불허하는 유연성과 맞춤 설정을 제공하여, 고유한 요구 사항에 맞춰 분석을 미세 조정할 수 있게 합니다.

몇 분 만에 사용자 지정 시각화 몇 줄의 코드로 모든 JavaScript/TypeScript 컴포넌트를 드롭할 수 있습니다.
코드 우선 또는 WYSIWYG 깔끔한 API 또는 드래그 앤 드롭 디자이너를 통해 대시보드를 생성하세요. 선택은 당신에게 달려 있습니다.
즉시 차트 필터 실시간으로 데이터를 슬라이스, 다이스하고 탐색하세요.
바로 사용 가능한 템플릿 세련되고 반응형 레이아웃으로 프로젝트를 시작하세요.
원활한 링크 연결 컨텍스트를 잃지 않고 다른 대시보드나 URL로 이동합니다.
원클릭 데이터 블렌딩 여러 소스를 단일하고 통합된 뷰로 병합합니다.
픽셀 단위의 UX 제어 모든 워크플로우에 맞게 사용자 지정 메뉴, 툴팁 및 필터를 주입합니다.
완벽한 테마 및 브랜딩 제어 자체 팔레트, 글꼴 및 로고를 적용하여 완벽하게 브랜드화된 경험을 제공합니다.
즉석 계산 필드 더 깊은 통찰력을 위해 새로운 측정항목을 즉시 생성합니다.
모든 것을 드래그 앤 드롭 쉬운 제스처로 차트와 위젯을 재배열합니다.
스마트 드릴다운 단일 클릭으로 요약에서 세부 정보까지 확대합니다.
예측 분석 및 예측 내장된 예측 모델로 발생하기 전에 추세와 이상 징후를 포착합니다.


기존 권한 모델이 결정합니다 AI 분석 기능은 Reveal에 있습니다.
사용자가 제어합니다:
이를 통해 대화형 분석이 계속 안전하고 감사 가능하며, 예측 가능하도록 보장합니다..
Reveal은 멀티테넌트 환경, 테넌트 수준 격리 및 고성능 쿼리 실행을 지원합니다.
Reveal은 귀하의 애플리케이션 및 인프라 내에서 실행되므로, 캐싱 전략, 확장 정책 및 배포 모델에 대한 통제권을 유지할 수 있습니다.
팀은 보안, 규정 준수 및 인프라 요구 사항에 따라 클라우드, 하이브리드 또는 온프레미스 분석 환경에 Reveal을 배포할 수 있습니다.
AI 기반 기능은 구성 가능한 사용 제어와 함께 예측 가능하게 확장되어 비용 폭주를 방지합니다.
번호
AI는 Reveal의 기존 보안 경계 내에서 작동합니다. 행 수준 및 역할 기반 액세스 규칙을 준수하며, 외부 모델에 무제한 데이터 세트를 노출하지 않습니다.
조직은 AI가 데이터와 상호 작용하는 방식에 대한 완전한 통제권을 유지합니다.
예. Reveal은 전체 화이트 라벨 분석 분석 경험이 제품 인터페이스와 일치하도록 지원합니다.
팀은 다음을 제어할 수 있습니다:
이를 통해 분석이 타사 도구가 아닌 제품의 네이티브 부분처럼 보이게 할 수 있습니다.
Reveal은 광범위한 엔터프라이즈 및 SaaS와 통합됩니다 데이터 소스, SQL 데이터베이스, 클라우드 데이터 웨어하우스, REST API, 및 실시간 데이터 스트림을 포함하여.
이러한 유연성은 엔지니어링 팀이 파이프라인을 재구성할 필요 없이 분석을 기존 데이터 아키텍처에 직접 연결할 수 있도록 합니다.


