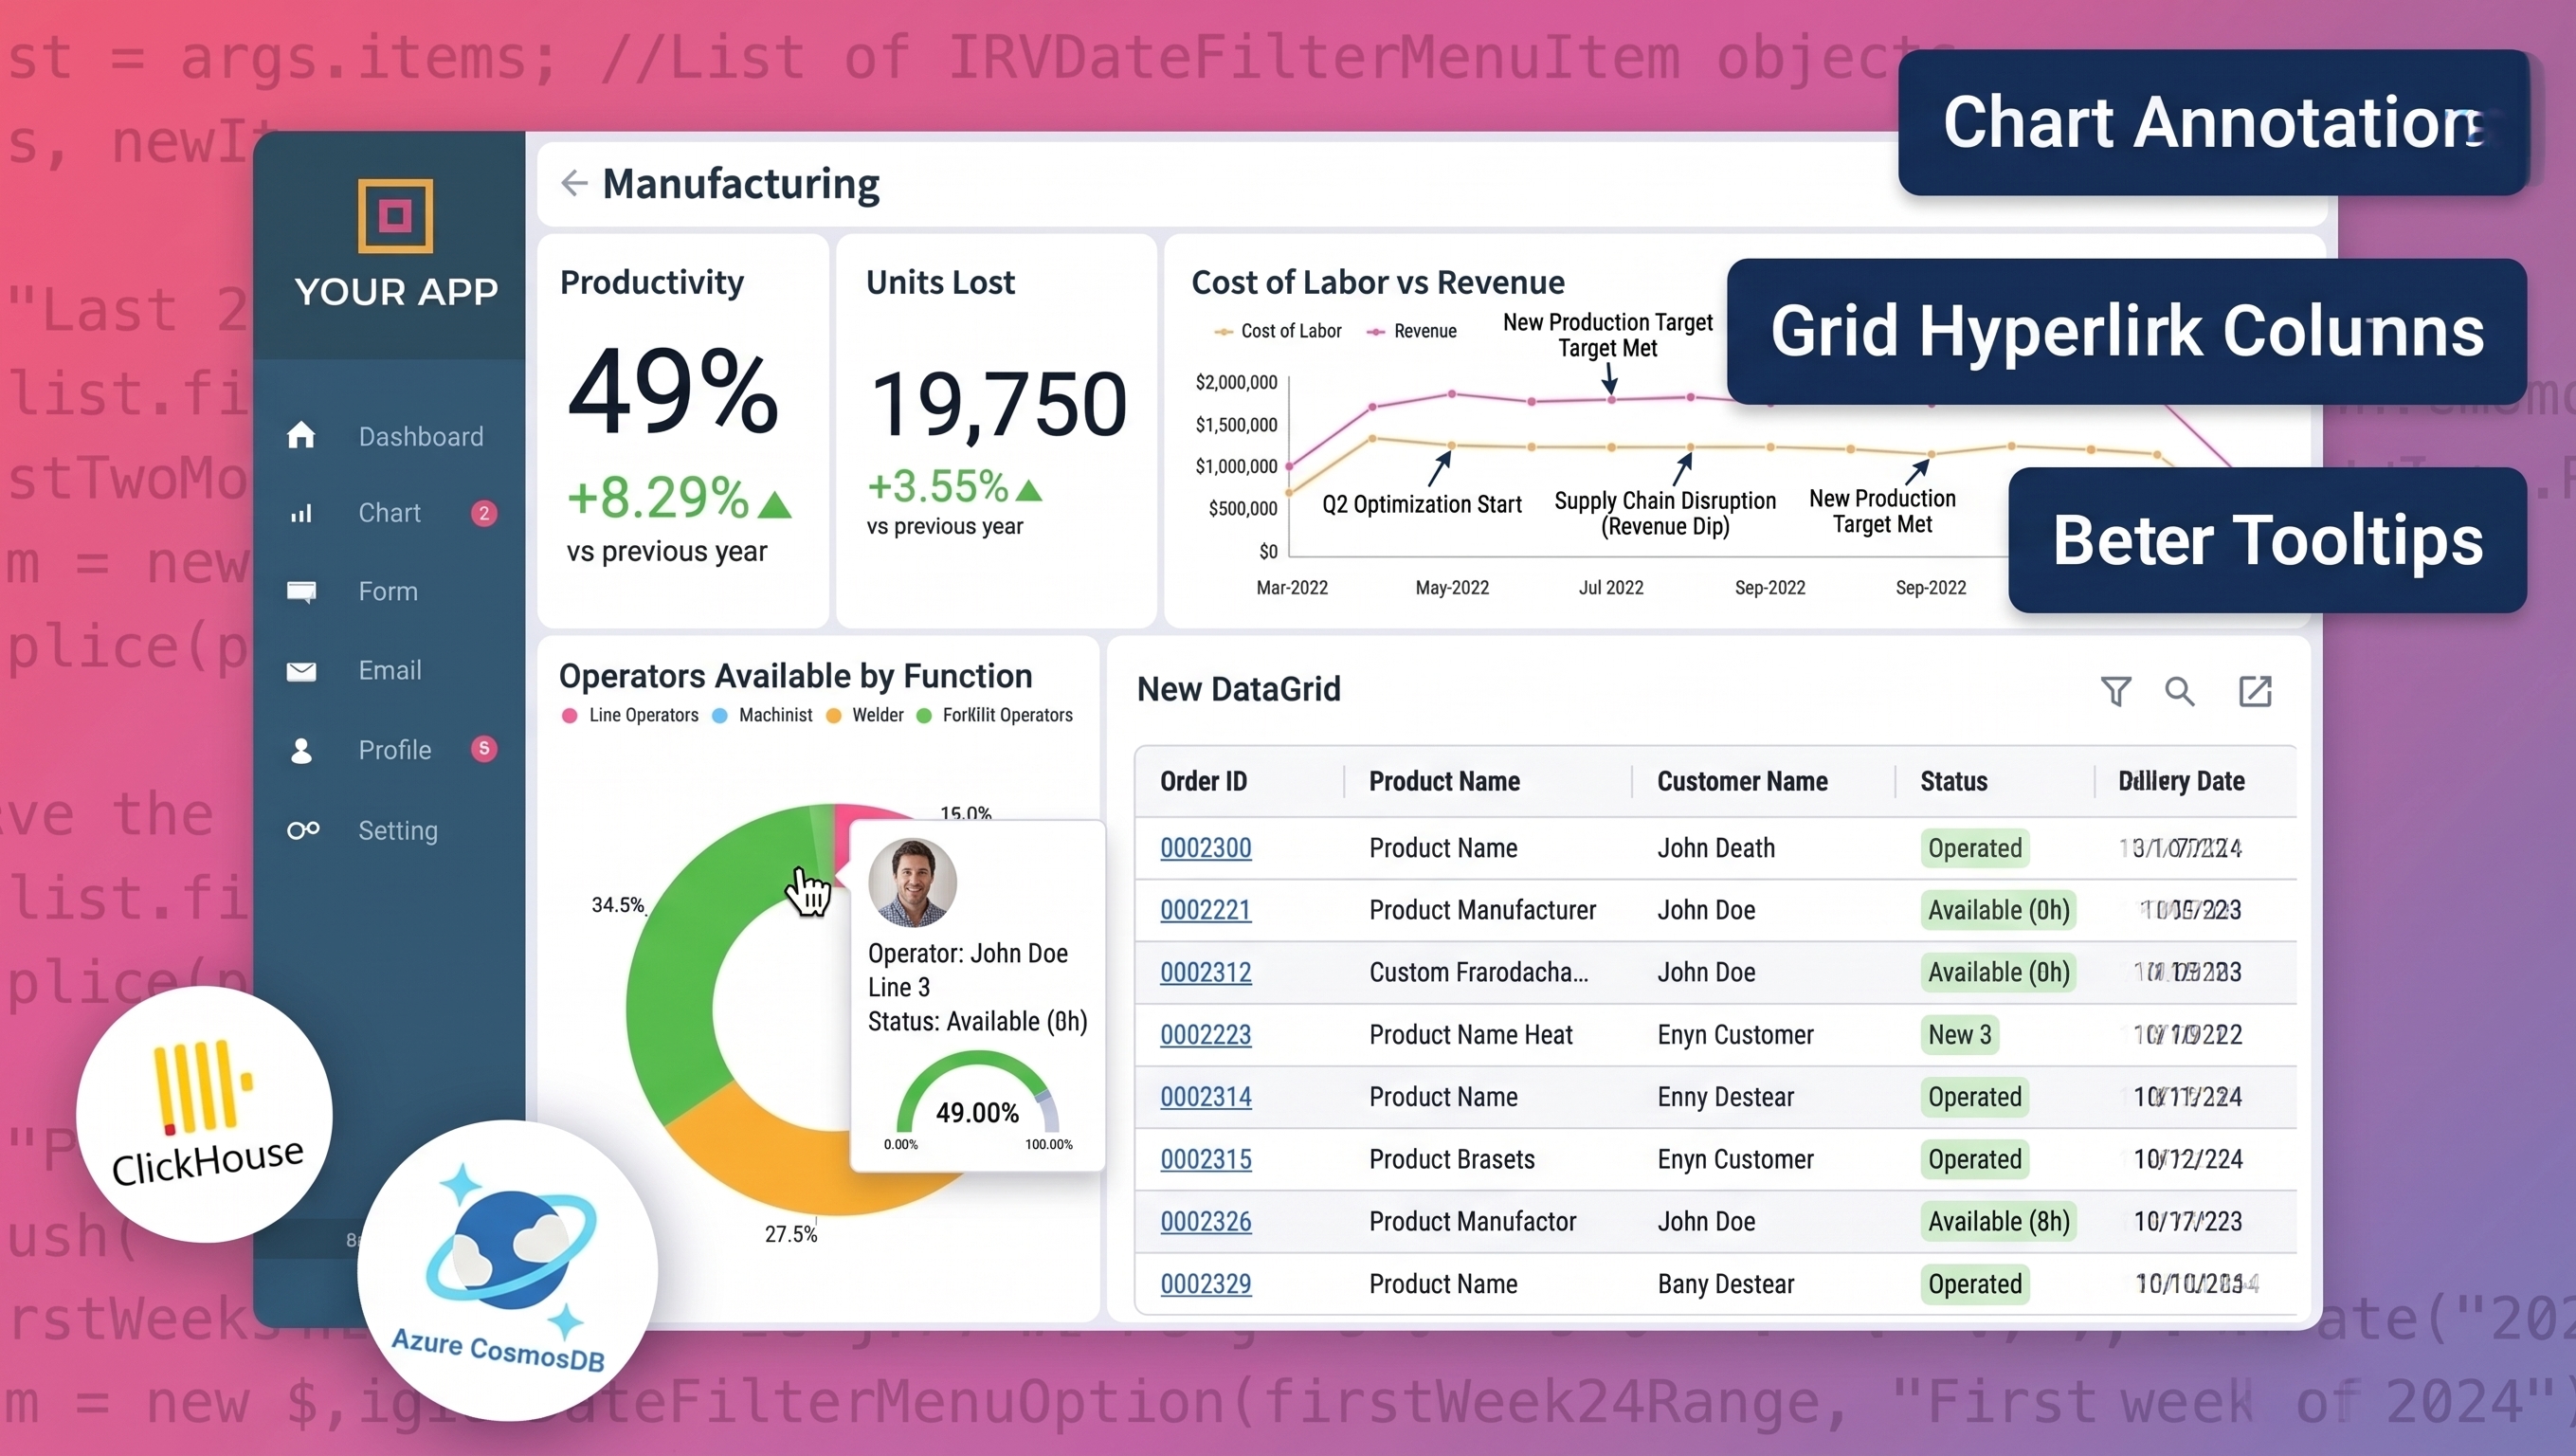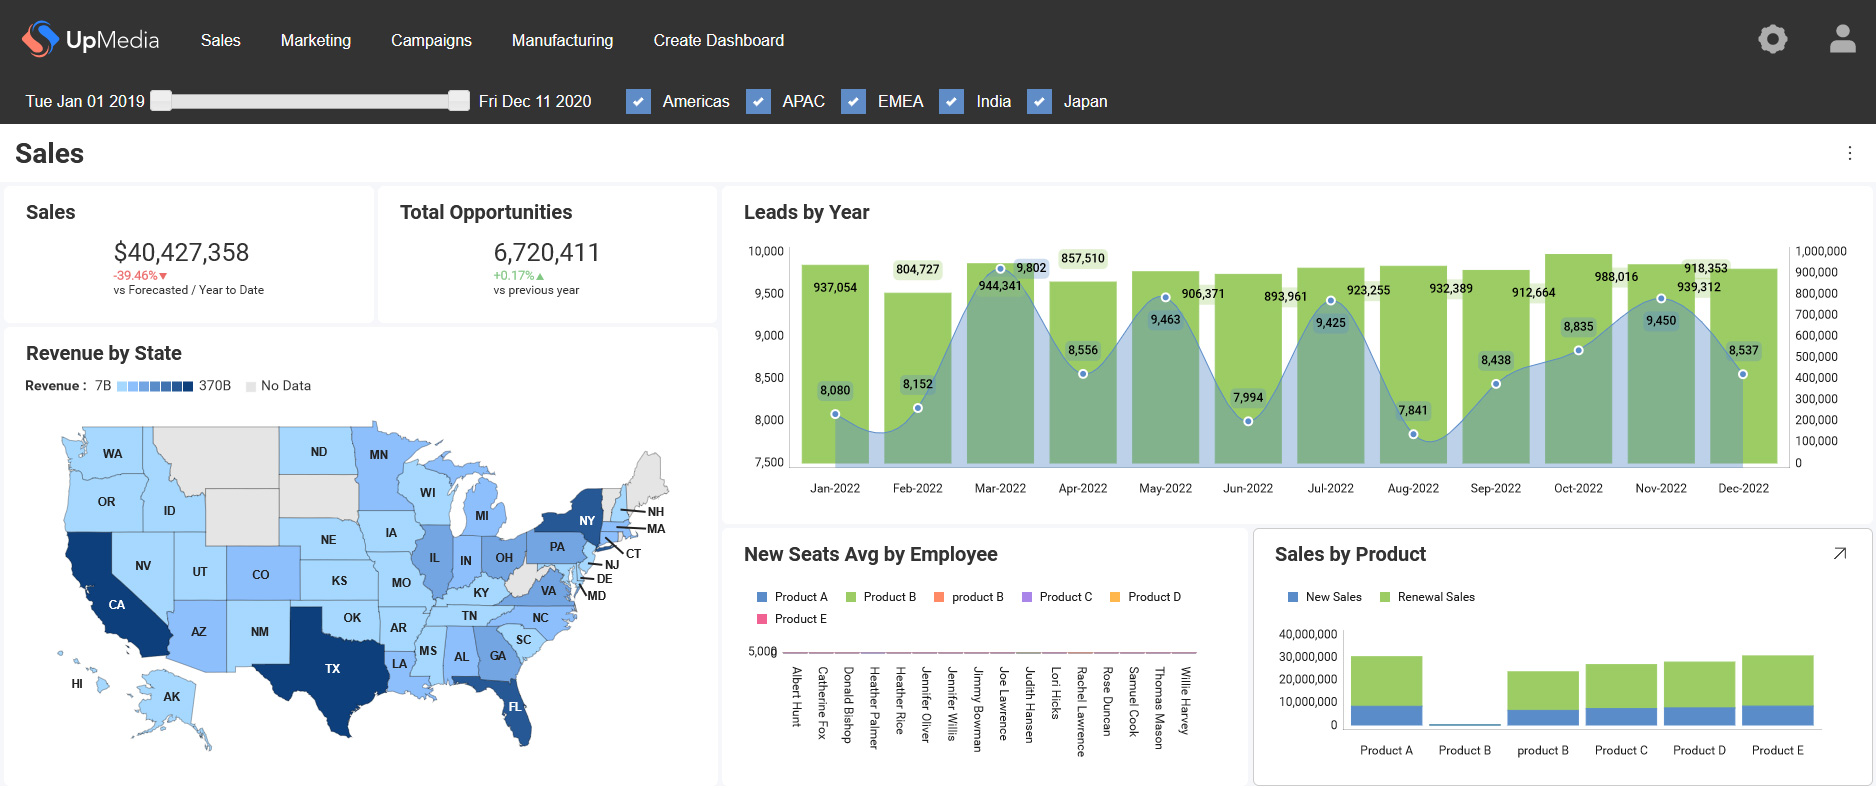
Scriptly Helps Pharmacies Identify Trends in Real Time with Reveal
Explore the complete guide to embedded analytics, including architecture, security, AI capabilities, implementation patterns, and evaluation criteria for modern applications.
Read Now
Fully branded white label dashboards offer custom personalization so that your customers can present a holistic service that is all branded to one company.
Read Now The Reveal November release adds AI metering and billing, row-level security, a time zone API, Reveal Skills for AI coding agents and a new Trust Center.
Executive Summary:
Key Takeaways:
This month’s release covers Reveal SDK 2.3.0, which shipped on November 5, 2026, along with Reveal AI, Reveal Skills for AI coding agents and a new Trust Center.
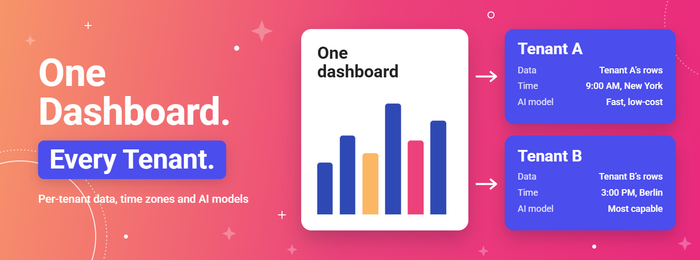
If you embed Reveal in a product you sell, most of it comes down to two things - controlling what AI costs, and showing each customer only their own data, in their own time zone.
Upgrading an existing integration? Read Before you upgrade first.
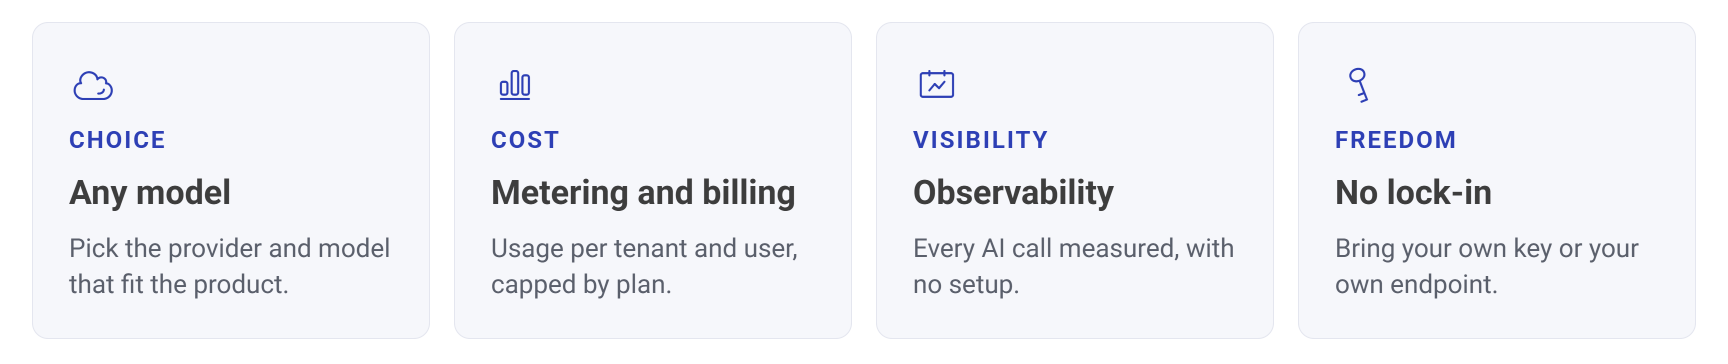
The usual objections to embedding AI in a product are cost and control. Who pays for the tokens, and what stops one customer from spending the whole budget?
Reveal AI is a separate package. Start with System Requirements if you want to lay hands on it.
Reveal AI works with OpenAI, Anthropic, Azure OpenAI, Google Gemini and any OpenAI-compatible service. A profile names a model and its settings, and you decide which profiles each of your customer plans includes.
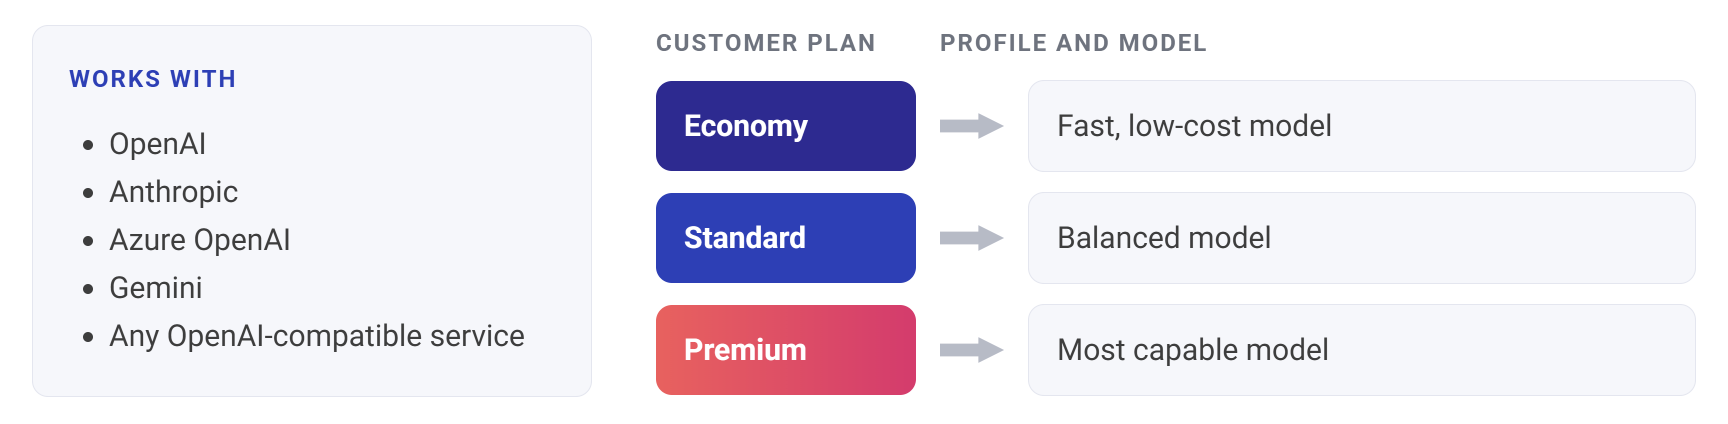
An entry plan can run a fast, low-cost model while your top plan gets the most capable one. Your client code sees only profile names, never a model ID or an API key.
The plan mapping is covered in Profile Selection.
You can also pick the model per workflow. Reveal tags every AI call with an intent, such as generation-build-report or datasource-ranker, and you can map an intent to a profile: dashboard generation on a larger model, background steps such as datasource ranking on a fast, inexpensive one. A mapped intent takes precedence over the profile the client requests, so it applies to every plan. See Intents.
Every AI call made for a user passes through a quota gate with two steps:
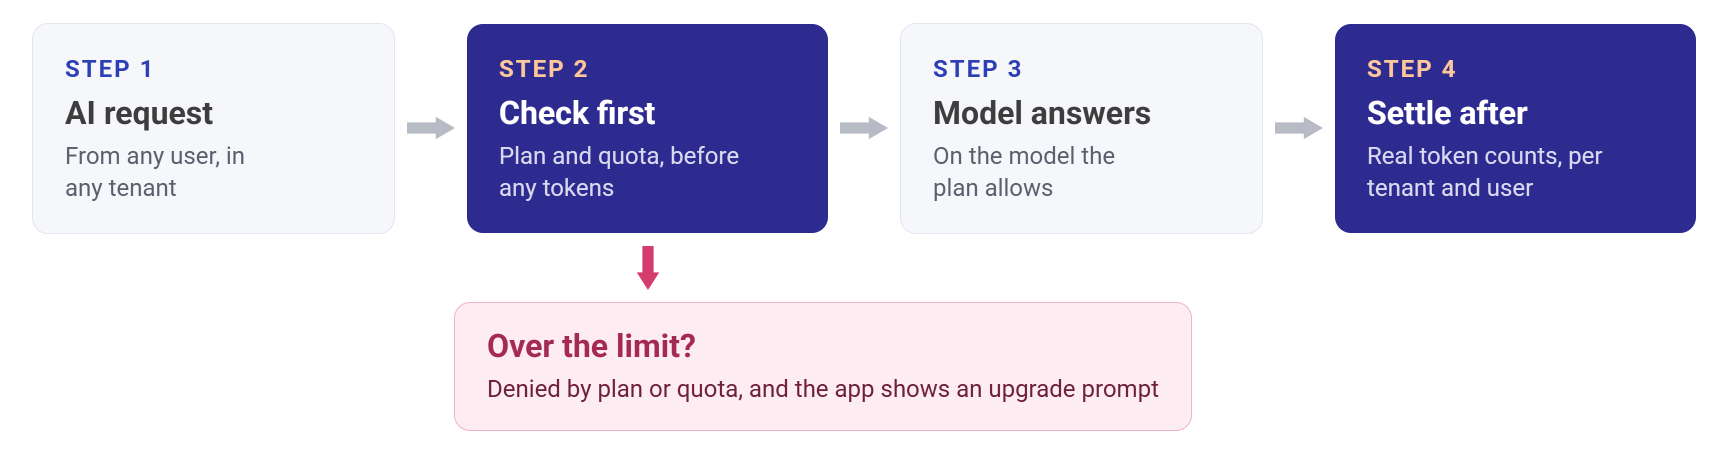
A denied call never reaches the provider. Your app gets a stable error code, such as ai.quota_exceeded or ai.not_entitled, so it can show an upgrade prompt instead of a generic error. The full list of codes is in Error Handling.
Plan your limits around provider calls rather than user actions, because one chat message can make several calls. Metering and Billing compares the quota gate with usage tracking, and the full billing example is in Quotas and Billing.
Reveal produces a record for every AI call, with its feature, model, provider and token counts. Records never contain prompt or response text.
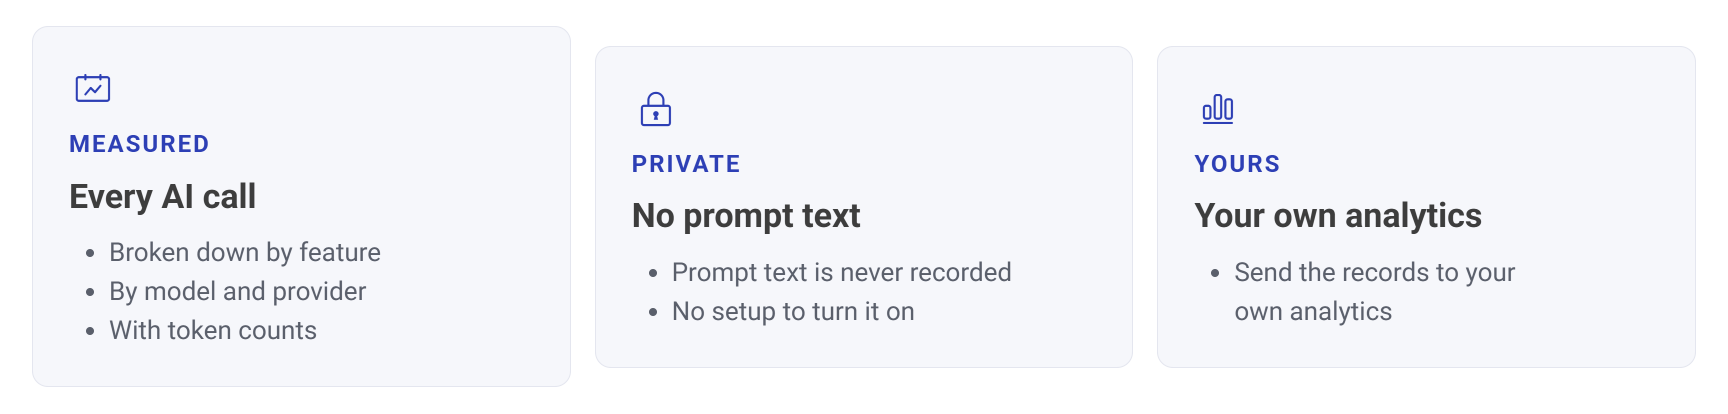
On ASP.NET, logs and metrics work with no setup, and you can export the metrics through OpenTelemetry. On every platform, a usage sink sends the records to your own analytics.
Use those records for reporting and bill from the settle step, because delivery to a sink is best effort. See Usage Tracking and Observability.
Buyers raise two objections about embedded AI, and each has an answer.
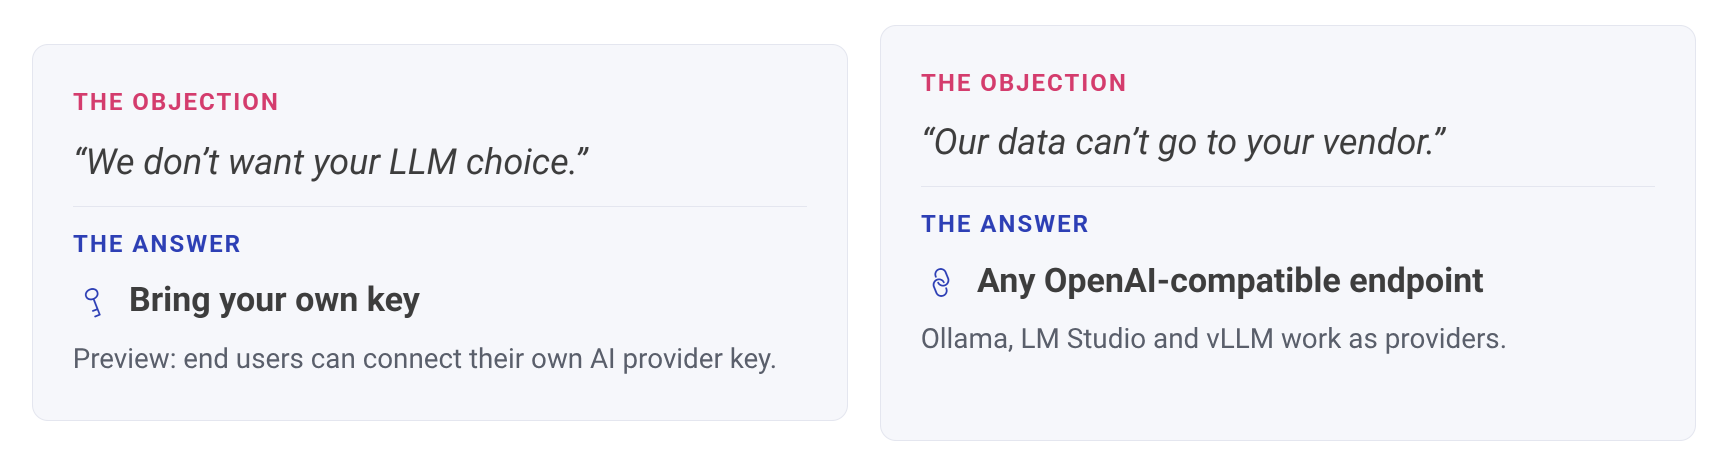
“We don’t want your LLM choice.” With dynamic profiles, in preview, each user connects their own provider key and model. Your application stores the connection details, and Reveal never stores or logs the keys.
There are two limits to know about: Google Gemini isn’t available for dynamic profiles, and datasource ranking during dashboard generation still runs on your models. See Dynamic Profiles (BYOK).
“Our data can’t go to your vendor.” Any service with an OpenAI-compatible API, such as Ollama, LM Studio or vLLM, works as a provider. See Custom Endpoints.
To review what reaches the model in the first place, Data Handling lists what each AI operation sends, including sample field values from your data.
Dashboards have always shown a timestamp as it was stored, so 14:00 UTC read as 14:00 UTC in New York and in Berlin. With the new time zone API, the same timestamp shows as 9:00 AM in New York and 3:00 PM in Berlin on November 4.
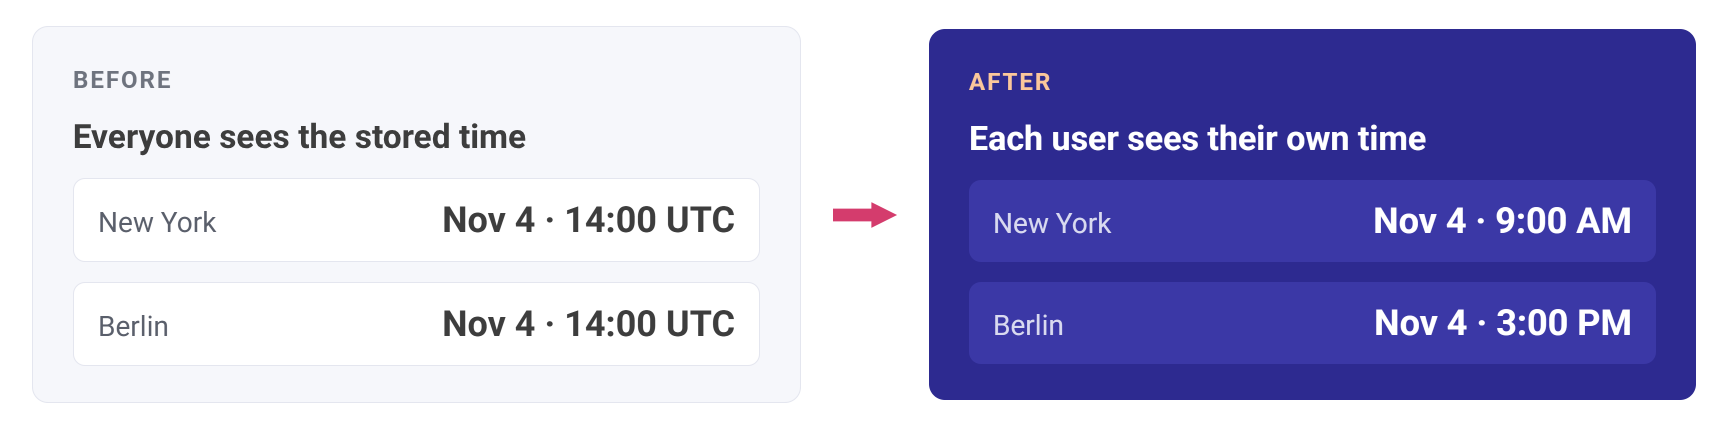
Set RevealSdkSettings.timeZone to follow each user’s browser, or to a time zone saved in your app’s user profile. Reveal converts DateTime fields on the server and relative date filters such as Today follow along, with no changes to dashboards or data sources.
The time zone can also be switched live. Changing it on an open dashboard reloads the data in place and keeps filter selections, drill-down and the maximized visualization.
Reveal doesn’t include a picker, so your app provides the control, and Time Zones has an example you can copy.
A few things to check when you adopt it:
applyTimeZone() needs that formula removed, or values convert twice.TimeZone option and use UTC when it isn’t set.Build one dashboard, and each tenant sees only its own rows.

You set a row filter on a data source item in your server’s data source provider, using the user context of the request. Reveal applies it to every query that reads the item: visualizations, totals, filter value lists, blended data and exports. It’s available in the ASP.NET, Java and Node.js server SDKs, and your client code doesn’t change.
How it protects the data:
A filter can match the user’s tenant, a list of values or an expression, filters can be combined, and named roles such as administrators can be exempt.
Two things to get right:
Setup for each platform is in Row-Level Security.
If you build with Claude Code, GitHub Copilot, Codex or Cursor, Reveal Skills teach the assistant how Reveal works, so a prompt like “Embed a Reveal dashboard in my app” produces code that follows the SDK.
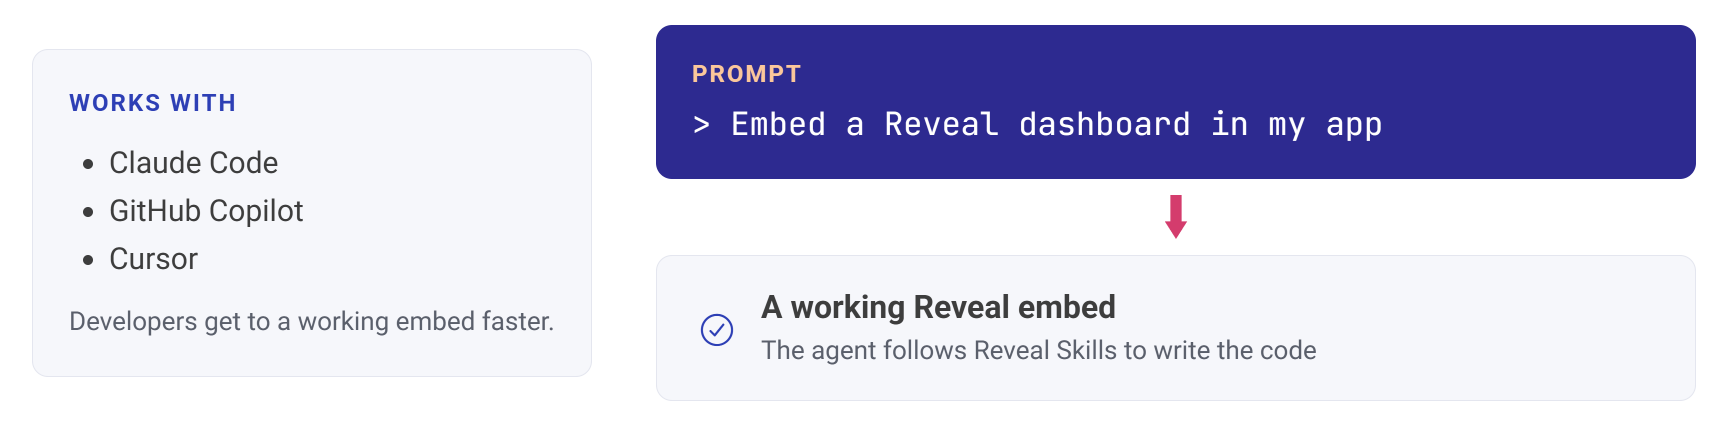
There are two skills:
reveal-embed covers server and client setup, data sources, user context and theming.reveal-dashboard-authoring creates and edits .rdash files in code with the Reveal DOM.They’re public in the Reveal.Sdk repository, and AI Agent Skills covers installation. Don’t forget to give our repo a star while you are there!
The Trust Center gathers what a security review asks for in one place: where Reveal can be deployed, how it fits your identity model, who is responsible for what, and a production checklist.
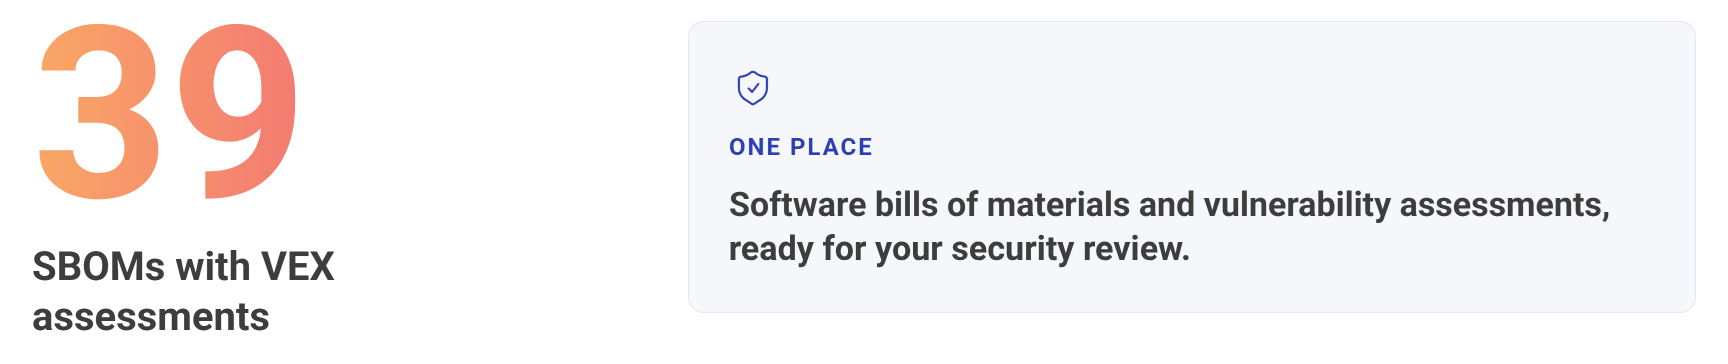
Its Software Bill of Materials page has CycloneDX SBOMs with VEX assessments, across the Reveal server, client and AI packages.
Time zone conversion and row-level security run on Reveal’s new data engine, which is now on by default on both the client and the server.
It pushes aggregation, filters, joins and paging down to your data source wherever the connector supports them, so the database does that work instead of Reveal. A few results can differ from the previous engine, and Before you upgrade lists them.
Excel and CSV exports used to send the visualization data from the browser back to the server, so large grids could fail at the server’s request size limit. Now the client sends only the dashboard, with its filters and sorting, and the server runs the queries.
1.23M keeps that format, and the cell holds the exact value.See Exporting and Server Export.
SslMode and SslRootCertificate.CommandTimeout and ConnectionTimeout are available on PostgreSQL, Redshift, MySQL, MariaDB, SQL Server, Oracle, Snowflake and Sybase.Connection details for each source are in Data Sources.
italicFont and boldItalicFont settings. See Theme Fonts.Check these against your integration before you move to 2.3.0:
ROW, PREVIOUS and the deprecated aggregation functions are rejected with an error in pre-calculated fields, which run before aggregation. They still work in post-calculated fields, the ones you add under Values.advancedSettings must be a Map.onUrlLinkRequested, args.url now holds the resolved URL, and args.urlTemplate holds the template.italicFont or boldItalicFont.Every feature, fix and breaking change, including how to turn off the new engine, is in the 2.3.0 release notes.


 Return to Blog

 ChatGPT
 Perplexity