Scriptly Helps Pharmacies Identify Trends in Real Time with Reveal
Reveal business intelligence blog gives you the latest embedded analytics trends, how-tos, best practices, and product news.

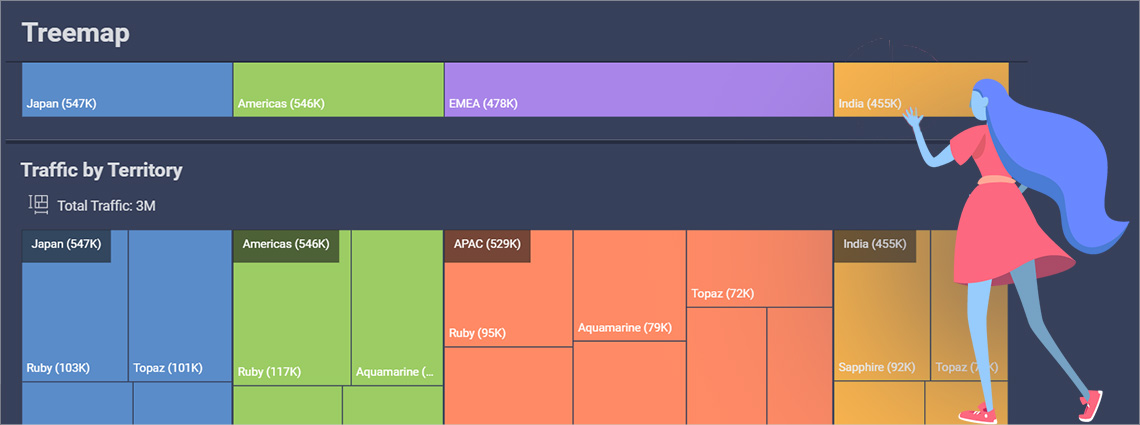
A Treemap Chart is designed for drill-down scenarios. It shows the relative weight of data points at more than one level allowing users to continuously drill down deeper into the data set that is represented by smaller rectangles for more efficient analysis.
Continue reading...Back to Top