
Dashboard Linking in Embedded Analytics: Definition, Benefits & Use Cases
Learn how dashboard linking can provide seamless navigation between interconnected dashboards and enhance your data exploration.
Embedded analytics platforms have gained popularity as businesses seek to leverage data for decision-making and gain a competitive edge.
However, not all solutions are the same.
So, before choosing a vendor, consider the embedded analytics features it offers – these capabilities allow users to simplify the analysis process and make decisions based on hard solid facts easier.
One of these features you should look for is dashboard linking.
The following article will delve into dashboard linking, its advantages, and potential benefits across various industries. We will also explore the practical application of dashboard linking in the Reveal platform, providing insights into how you can leverage it effectively.
What Is Dashboard Linking?
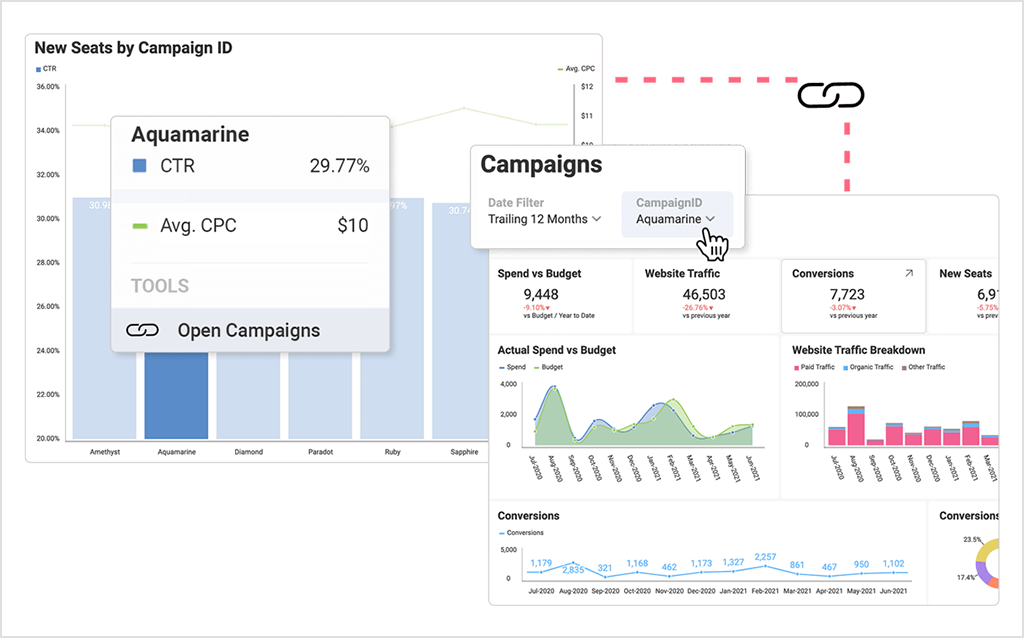
In embedded analytics, dashboard linking refers to the ability to connect and navigate between multiple dashboards. This capability allows users to access related or complementary information seamlessly by following links of interactions between the embedded dashboards.
Dashboard linking in embedded analytics typically involves buttons, hyperlinks, or tabs that facilitate the movement between dashboards. These elements can be configured to pass parameters or context information to ensure the linked dashboards display the appropriate data and maintain continuity in the analysis process.

How Does the Data Analysis Process Benefit from Dashboard Linking?
Think of software incorporating embedded analytics to provide data insights to its users. Within this software, users work with numerous dashboards representing different data points and insights. These dashboards could include all the data a given organization possesses – sales performance, customer demographics, content marketing KPIs, app usage, inventory levels, or order delivery times.
Dashboard linking becomes useful if you want to navigate these different dashboards to explore related information or drill down into specific details. For example, users can click on a particular usage region from the app usage dashboard to open a detailed dashboard focusing on that region’s performance. From the region’s performance dashboard, they might be able to go to another dashboard and view specific product features that are popular among the region’s users.
The purpose of dashboard linking in embedded analytics is to simplify the data analysis process by providing a seamless and cohesive user experience, allowing users to navigate relevant dashboards without leaving the software application they are already using. With dashboard linking, users can gain deeper insight and make smarter and, most of all, data-driven business decisions based on the interconnected information available.
Overall, dashboard linking in embedded analytics promotes efficient data exploration, provides contextually relevant insights, supports informed decision-making, and enhances the user experience by enabling seamless navigation between interconnected dashboards within an application or software platform.
Dashboard Linking Use Cases in Different Industries
Dashboard linking can be applied in various industries, allowing business professionals to understand data better, get more out of it and facilitate informed decision-making. Here are some examples:
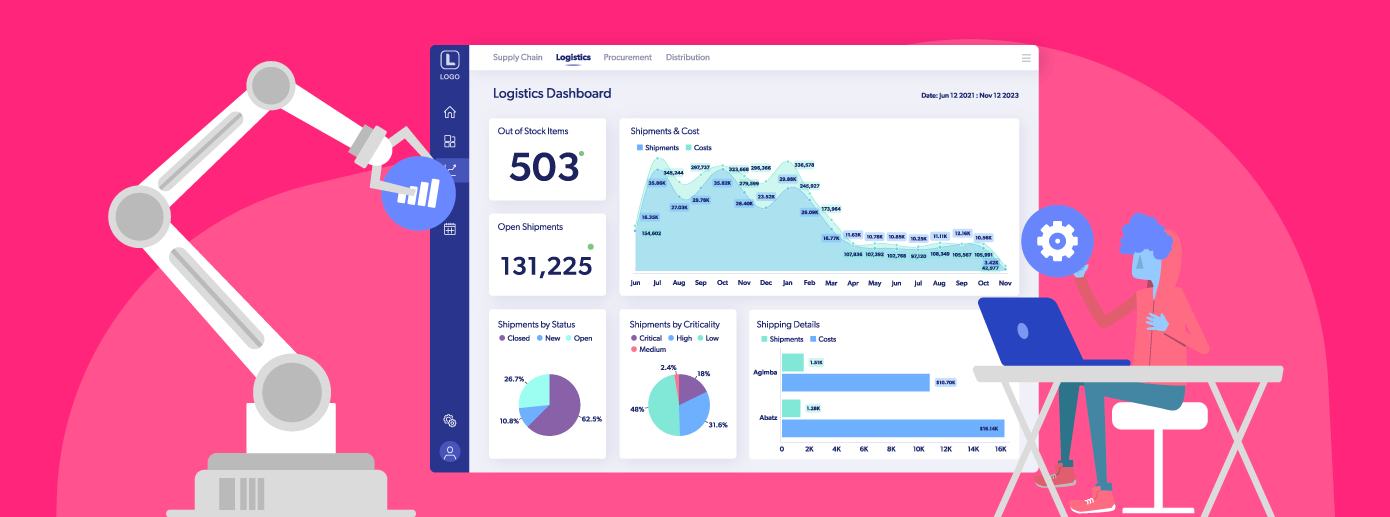
- Dashboard linking in the manufacturing industry: Linking supply chain dashboards with procurement and logistics dashboards can provide end-to-end visibility, allowing manufacturers to optimize inventory levels, reduce costs, and improve delivery times.
- Dashboard linking in the financial services industry: Linking risk assessment financial dashboards with compliance dashboards can help identify potential risks, monitor regulatory compliance, and facilitate proactive risk mitigation strategies.
- Dashboard linking in the healthcare industry: Linking patient records, medication history, and treatment plans with real-time healthcare monitoring dashboards can support coordinated care among healthcare providers, ensuring timely interventions and reducing medical errors.
Introduction to the Dashboard Linking Feature in Reveal
Reveal supports dashboard linking by directly connecting visualizations in a dashboard or an entire dashboard to other dashboards or URLs. With dashboard linking in Reveal, you can pass parameters and filters between dashboards to simplify drilling down to additional insights. For example, if you want to provide more details on the information displayed in a visualization, you can use an entirely new dashboard. This can be very useful with Company 360 dashboards, where you can establish top-down analysis paths, where you go from a high-level overview of the reality of a business to more detailed views with the specifics.
How to Apply Dashboard Linking in Reveal?
In Reveal, it is possible to associate actions with specific events. Opening another dashboard is one of two supported actions. The second one is opening a URL. This enables extensibility scenarios, such as interacting with third-party web applications as part of the dashboard navigation.
You can add links through the Settings section of the Visualizations Editor under +Links. Alternatively, you can Connect this visualization to another dashboard or a URL.
*The added link will appear as a symbol on the visualization configured for when the dashboard is in View Mode.
Events / Triggers
The control in the Links section selects the event or trigger that will be used to fire the action. Possible options are:
- Value is Selected: The event is triggered whenever a user selects a row in a grid view. In other visualizations, such as charts, it is triggered whenever you select a data item from the chart. This might include columns, bars, pie slices, or other elements that depend on the chart type used in your visualization.
- Visualization is Maximized: This event is triggered whenever a visualization is maximized in the dashboard view.
Linking to Another Dashboard
Linking to another dashboard allows you to jump from a specific point in one dashboard to another. This point can be a visualization or a particular value in a visualization, depending on the link trigger you chose.
- Prepare the dashboard you are linking to. Carefully consider the relation between the two dashboards.
Adding filters in advance to the dashboard you are linking to and the main dashboard will allow you to connect the two dashboards by a common field. This field will be a filter in the second dashboard and a measured category in the first dashboard.
- After preparing the dashboard, you are linked to open the main dashboard where you want to add the link. Select the visualization on which you want the link symbol to appear and open it in the Visualization Editor.
- Go to Settings and select the + in Links to open the New Link dialog:
Here you will need to configure two parameters:
- The Dashboard will be opened when the link symbol is clicked.
- The Link Name is the title the users will see if they select the grid row or chart element.
Suppose you have added dashboard filters to the target dashboard. In that case, you will also need to connect the dashboard filters to their corresponding fields in the visualization dataset to which you are adding a link.
Click Done and go back.
- Select the Create Link blue button.
The link to the dashboard will appear under Links in the Visualization Editor. You will notice that the Trigger setting has also appeared.
Adding a URL
Adding a URL is another option in the New Link dialog. It enables you to open the configured URL in your device’s browser.
There are two parameters that you need to define:
- The URL the visualization will point to. You will be redirected to it once the link symbol is selected.
- The Link Name is the title the users will see if they choose the grid row or chart element.
For URLs, you can also include Variables that will dynamically construct the URL the user will be linked to based on the values in your visualization fields. For example, let’s take a look at the following visualization link:
The URL has been set to http://www.en.wikipedia.org/wiki, and in this case, we selected the variable EmployeeName. Therefore, users who select the Navigate to Wiki link in the visualization will be redirected to:
http://www.en.wikipedia.org/wiki/[EmployeeName].htm
Where [EmployeeName] will vary depending on the values in the EmployeeName field.
Dashboard Linking with Reveal in Action
For a full tutorial, watch this video that walks you through the steps of dashboard linking in the Reveal platform:
Over to You
We hope you enjoyed learning about dashboard linking with us. If you’re interested in testing out the feature in our product but are facing any issues or just need some extra guidance, get in touch with our product team via our Discord channel.
And if you’ve been using the dashboard linking feature in Reveal, we would love to hear what you think of it. Reveal is a customer-driven product- we deliver features and functionalities based on your continuous feedback so you can provide more value to your customers. Let us know if you think there is anything else we can add to improve Reveal’s ease of use.
And if you’re new to Reveal but curious to learn more about our product, you can schedule a free product tour so we can take you through Reveal’s different features and functionalities. Alternatively, you can also download our SDK and try it yourself.


