Explore the complete guide to embedded analytics, including architecture, security, AI capabilities, implementation patterns, and evaluation criteria for modern applications.
White-Label Software and Analytics: Enhancing Your Brand
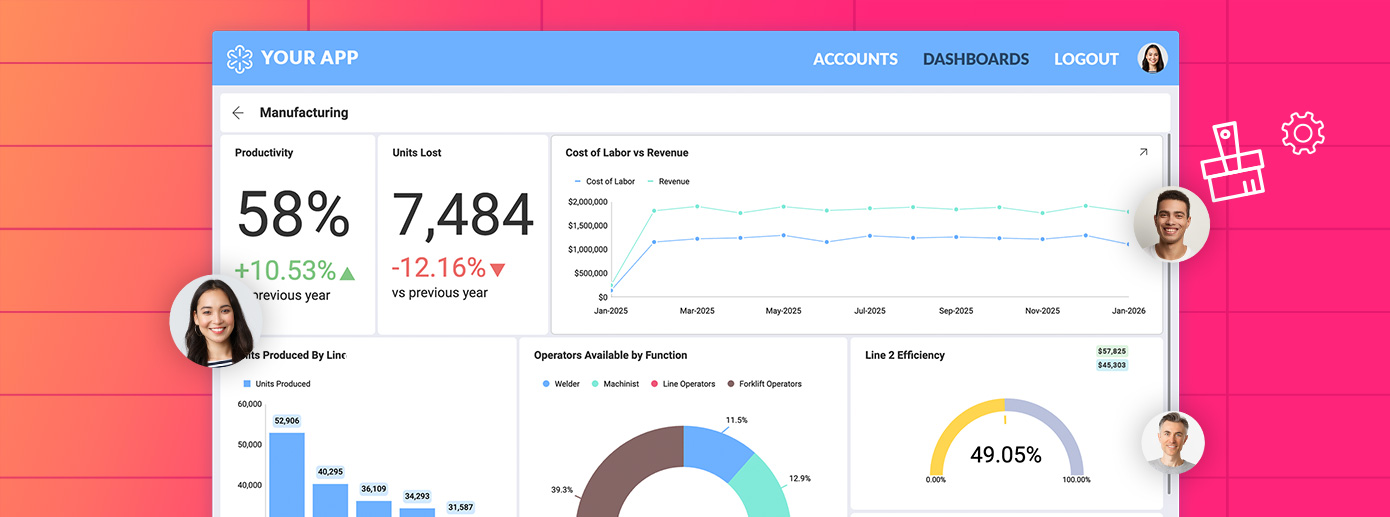
Fully branded white label dashboards offer custom personalization so that your customers can present a holistic service that is all branded to one company.
Creating a Data-Driven Culture with Embedded Analytics
What is a Data-Driven Culture?
Data-driven cultures make data an imperative part of everyone’s daily workflow, and these organizations use data to execute and prioritize initiatives. A culture that is data-driven also instills trust and commitment in all members of the organization as they can collaborate fluidly with transparency based on shared metrics with data at their fingertips.
This whitepaper will give you the keys to building a culture where everyone collaborates based on data, helping to make smarter, faster decisions. From your business leaders to analysts to your information workers – everyone is included in ensuring a data-driven culture is successful.
We are estimated to create more than 2.5 quintillion bytes of data daily. And this is only expected to increase. But many companies and organizations have been unable to fully harness this data to enhance business performance.
Those organizations that use data strategically rely on data as a key asset for gaining insights and influencing business processes across the organization. They can make smarter, data-based decisions rather than rely on assumptions or “gut feelings.”
Data-driven insights can help a marketing team, for example, discover new trends and pinpoint leaks in its customer buying funnel. The ability to gather, understand, and identify key opportunities with your data will set you up for success.
By 2022, more than half of major new business systems will incorporate continuous intelligence that uses real-time context data to improve decisions.
While it is easy for many people to trust their intuition when making decisions, is it the best approach to making business decisions? More and more, the answer is “no.” With data more easily available, especially in those applications that use embedded analytics, people can more quickly reference data in data visualizations or dashboards to make better, faster decisions.
Therefore, creating a data-driven culture is important, especially in these key areas:
Optimizing business performance: When you are making and prioritizing decisions based on data, it allows you to identify key leaks in the customer funnel you need to fill and which actions will yield the most results.
Experimental decision-making: When you can experiment and growth hack parts of your customer funnel, you can analyze the results quickly and act.
Promote cross-team collaboration: Foster more collaboration from within your organization when people are joining forces and bringing different ideas from different departments.
Enabling data for everyone: Remove the obstacles it takes for people outside of IT to get their hands-on data when the proper tools are made available to everyone.
Gain a competitive advantage: When you can truly understand the market, customers, and trends in your data, you can be one step ahead of your competitors.
According to a survey conducted by the Business Application Research Council {BARC), “establishing a Data Driven culture” was the third most important trend in Business Intelligence in 2020. It is becoming more and more clear how data is changing the way that businesses and people operate in their daily ways
Kate Smaje, a senior partner and global co-leader of McKinsey Digital
In their report on digital transformation, McKinsey Digital notes that data is providing the fuel to power better and faster decisions and states: “High-performing organizations are three times more likely than others to say their data and analytics initiatives have contributed at least 20 percent to EBIT (from 2016–19).
Here are more specifics on the benefits a data-driven culture provides:
More confident decision-making: When people can better understand the impact of their decisions, they tend to feel more confident in making them. Data is more legitimate and solid than a gut feeling, helping to remove subjective decision-making. However, just because you are making decisions based on data does not mean they will always be correct. It is important that you measure and monitor the metrics continuously and map them to each decision.
Becoming more proactive: Data can provide early insights to help identify business opportunities and detect customer journey “leaks” caused by lower marketing leads, conversions, or weaknesses in your product before they become serious problems.
Company success and longevity: A more agile organization that can pivot and maximize its resources will succeed.
Awareness and transparency: Keep everyone in your organization in the know, aware of company goals, customer satisfaction, and more. This helps motivate employees to achieve team goals and helps improve company performance.
Answer the Why: Gain a deeper insight into your customer’s journeys, and identify funnel leaks and success points to drive acquisition. We all know the data points that are not performing as well as we would like or meeting industry standards. So, we all ask why? When you have data set up through all points of your customer funnel, you can start to answer these questions.
Identify New Revenues of Growth: Tying company insights into market trends can help discover new revenue streams.
The following chapters will give you keys to building a culture where everyone collaborates about data and makes smarter, faster decisions. From your business leaders to analysts to your information workers – everyone is included in ensuring a Data Driven culture is successful.
Embed data and analytics into business strategy and digital transformation by creating a vision of a Data Driven enterprise, quantifying and communicating business outcomes and fostering business changes fueled by data.
Businesses worldwide are beginning to adopt data and new trends such as AI and Machine Learning. However, culture is still a key factor holding them back from using that data effectively. And where does company culture start? At the very top.
Leaders need to shift the organization’s mindset to begin embracing data and alter how everyone approaches decision-making. According to a survey conducted by Deloitte and published in the Harvard Business Review, 63% of executives do not believe their companies are data-driven. So, how can you change the culture?
By taking the following actions, you can send a message to the rest of your organization:
Be mindful of using data every day in your work.
Make a point to ask for data prior to making decisions to enforce data-driven decision-making.
Communicate key performance indicators (KPIs) through different channels such as email, presentations, and meetings.
Set aside time for training yourself as an executive to learn new data skills
Promote data training in your organization.
Display metrics digitally throughout offices, meetings, and company web pages to keep data at the forefront.
Creating a data-driven culture relies on a long-term commitment to using data to make decisions for everyone in the organization. An initiative like this cannot be a set-it-and-forget-it process. Part of this is establishing a shift in culture. Being data-driven is more than just creating dashboards and looking at numbers – it is about changing your organization’s culture to think analytically.
To help drive this shift in culture and maintain commitment long-term you should:
Ensure analytics ties back to critical business efforts.
Keep data at the forefront of employee coaching.
Make sure team goals are always present for gauging team performance. This can be in the form of company newsletters, on TV around your office, etc.
Continuing investing in AI technologies will uncover deeper, not-so-obvious insights in your data.
Most employees and management in organizations want to know that they can trust the analytics they see. This is why it is important that everyone in your organization is basing their decisions on the same metrics. Therefore, having a single source of truth is so important. Without it you can have employees pulling metrics from different sources and risking inconsistencies, resulting in less trust in the data.
When there is one place for your users to find answers and consistent data, you eliminate the need for people to begin searching for different systems. This also makes it easier for the data administrators, so they only need to maintain data in one location.
Take some of the following steps to build out an environment that serves as a single source of truth that the whole organization can draw from:
Bring together your data administrators to inform them of the initiative and the value.
Work cross-departmentally to identify the data and views your end users need.
Cleanse the data so that it is easy for your end users to digest.
Choose a tool to build your single view in.
Ensure that everyone in your organization can access the data.
By 2023, data literacy will become an explicit and necessary driver of business value, demonstrated by its formal inclusion in over 80% of data and analytics strategies and change management programs.
Gartner
Knowing where to access data is just one piece of the puzzle. End users also need the skills to understand the data. Adjusting to working with data means changing the way we operate in our day-to-day activities. This means that people may not have the needed skills to be data-driven out of the box.
If your end users do not have a clear direction and understanding of the data, they will begin making assumptions, which contradicts a basic tenet of a data-driven organization.
Users also need to know the best way to consume this data so that it is telling the proper story. Following dashboard best practices is key for users who create and view different charts. Read our whitepaper about Best Practices for Creating Compelling Visualizations to learn more.
Developing a data literacy plan across organizations means you should ensure you accomplish the following action items:
Follow dashboard best practices for data visualizations.
Develop an organizational data glossary for end users to refer to.
Work with key stakeholders with the proper business and data domain to ensure proper definitions.
Use user-friendly names for the fields in your data.
Trying to force people to conform their work to preestablished numerical goals tends to stifle innovation and creativity—valuable qualities in most settings. And it almost inevitably leads to a valuation of short-term goals over long-term purposes.
Jerry Z. Muller, The Tyranny of Metrics
The first step in measuring business improvements is making sure that the key performance indicators (KPIs) are the ones that matter and are tied to your organizational goals. After all what you are tracking is what your efforts are working towards to improve, right?
First, ensure you understand a key performance indicator (KPI). KPIs are measurements that tell you how a process is performing so appropriate business decisions can be made. Organizations should have organizational-wide KPIs, such as sales targets, department-wide KPIs, such as the number of inbound leads marketing is generating, and performance-level KPIs, such as employee satisfaction, customer satisfaction, and customer retention.
So how do you know if you are tracking the right metrics or not? These steps will help you focus your KPIs and help you narrow down the ones that matter most:
Choose the right KPIs to measure success.
Research and look at historical data to set realistic goals.
Focus on a few important KPIs rather than too many.
Identify new technology needed for the organization to access and analyze data.
Assign data administrators responsibility for ensuring accurate data and providing the proper access to the organization.
Every beginner possesses a great potential to be an expert in his or her chosen field.
Lailah Gifty Akita, Think Great: Be Great!
Data can only make an impact if it’s incorporated in the decision-making process:
Training employees on “how” to get to data is just the beginning
How to turn that data into “actionable insight” is the real goal
What tools do you currently have or need to acquire?
Is data readily available? REST APIs, OData, direct connections?
Does my team understand data visualizations?
Do we hire a data scientist or build from within?
Can we do effective Data Storytelling?
Find key business stakeholders with a visibility and data mindset, give them data literacy training, and empower them to promote a Data-Driven culture in your organization.
How Embedded Analytics Can Foster a Data-Driven Culture
So, what is embedded analytics, and how does it tie back to creating a data-driven culture?
In contrast to traditional BI, which requires users to leave their workflow applications to look at data insights in a separate set of tools, embedded analytics lets users view data visualizations or dashboards in context—while in the application itself. Bringing data right into the user’s workflow without any disruption. And in return, delivering more value.
Introducing data into a user’s daily workflow makes it easier for people to see and act on insights and help program them to constantly think analytically.
By 2023, data literacy will become an explicit and necessary driver of business value, demonstrated by its formal inclusion in over 80% of data and analytics strategies and change management programs.
Casey Ciniello is a data and analytics-focused product leader at Infragistics, where she drives strategy and innovation for the Reveal embedded analytics platform and the Slingshot work management solution. With a BA in mathematics and an MBA, she brings an in-depth analytical foundation and business perspective to building products that help organizations turn complex data into actionable insights.
Casey leads the development of analytics-driven capabilities, shaping product direction through deep market analysis, user behavior insights, and evolving business intelligence trends. She works closely with customers to understand how data is used in real-world decision-making and translates those needs into intuitive, high-impact analytics experiences. Casey also serves as the Survey Lead for the annual Reveal Software Development Challenges survey, where she analyzes industry data to uncover key trends in analytics, AI, and modern development practices. Her insights and thought leadership have been featured in Dataversity, RT Insights, SaaSXtra, SD Times, Solutions Review, TechStrong IT, App Developer Magazine, Beta News, Integration Developer News, and UX Planet. She is a frequent webinar presenter on modern embedded analytics, machine learning, data visualizations, and scaling SaaS analytics. Casey joined Infragistics in 2013.
Your Privacy Matters:We use our own and third-party cookies to improve your experience on our website. By continuing to use the website, we understand that you accept their use.Cookie Policy.
We use our own and third-party cookies to improve your experience on our website. They also allow us to analyze user behavior in order to constantly improve the website for you. Please review our Cookie Policy and cookie settings below.
When you visit any website, it may store or retrieve information on your browser, mostly in the form of cookies. This information might be about you, your preferences, or your device and is mostly used to make the site work as you expect it to. The information does not usually directly identify you, but can give you a more personalized web experience. Because we respect your right to privacy, you can choose not to allow some types of cookies. However, blocking some types of cookies may impact your experience of the site and the services we are able to offer.
Your Privacy Matters: We use our own and third-party cookies to improve your experience on our website. By continuing to use the website, we understand that you accept their use. Cookie Policy.