Unveiling Reveal 1.6.6: Enhancing Your Analytics Experience
We are excited to announce the release of Reveal 1.6.6 which brings several new features and improvements that will enhance your embedded analytics experience. Here are some of the highlights of this release:
New Features
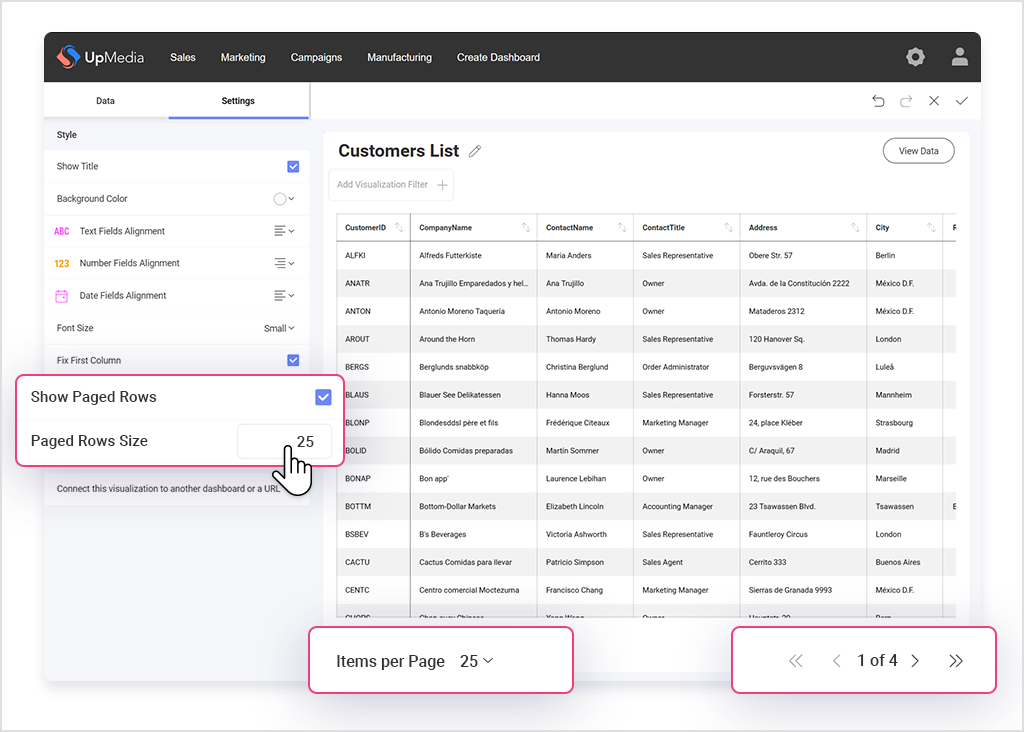
- Server-Side Paging: Server-side paging allows you to limit the number of rows sent to the client when displaying data in a Grid visualization. This greatly enhances performance while giving a nice user experience when interacting with large data sets. This is currently a beta feature, so we are looking for feedback! To enable server-side paging, simply set $.ig.RevealSdkSettings.enableBetaFeatures=true in your client JavaScript and in the Settings tab of a Grid visualization, you’ll see the new paging options.
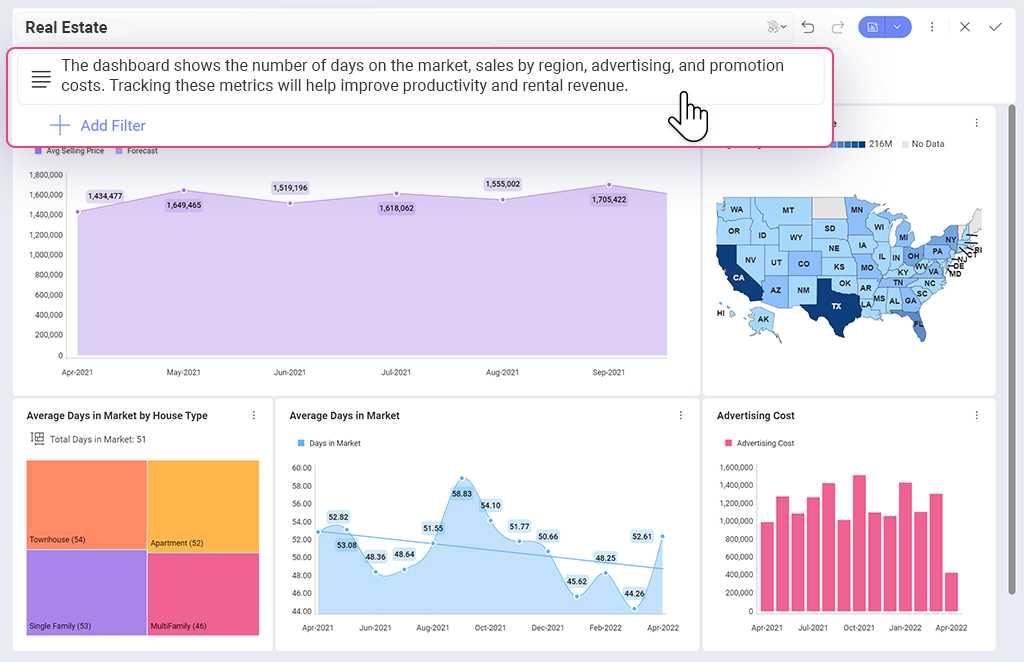
- Description Text Box: You can now add additional context to dashboards with the new Description text box. This is at the dashboard leveldirectly under the Title of the dashboard. The Description text box follows the same rules set in the canEditproperty on the RevealView. If users are allowed to edit a dashboard, they will be able to edit the dashboard description. To show or hide the Description text box, change the showDescriptionBoolean property in the RevealView.
- Enhanced PDF Export: PDF Export has been revamped for Grid and Pivot Grid visualizations. The new Grid and Pivot Grid export experience includes better handling of column widths, improved column and row overflow, and an updated PDF render to better track the same rows across exported pages for improved readability.
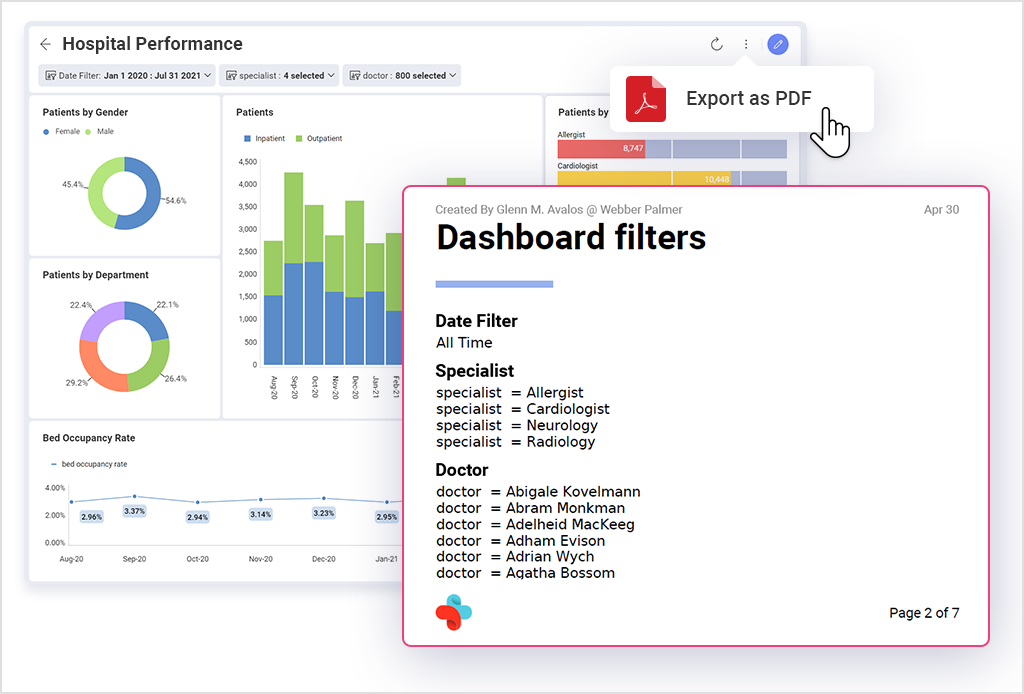
- Export Filters: When exporting to PowerPoint, PDF or Microsoft Excel, you will now see a cover page that describes the filters applied to the dashboard. This ensures that when your dashboard is exported, the viewer of that exported format will know if they are looking at all of the data or a subset of the data.
- Improve Load Performance: To better improved the load experience of a data scheme when creating a new visualization, we’ve added a flag to display the data previews when hovering over fields in the fields list of your data source. By default, we query the data source for 5 rows of data to display a sampling of each field in a tooltip. If you are using stored procedures with large datasets, this could impact performance. Set the isPreviewDataInVisualizationEditorEnabled to true to turn this data tooltip feature on. It is off by default.
- MySQL Server-Side Data Blending: MySQL now supports server-side data blending, which means the joined tables will now execute the query on the server, dramatically improving performance for large datasets.
- New Charts: We’ve enhanced the Radial charts with an updated code and a new look & feel. The old charts are still in the client library,however, they are deprecated and will be removed permanently later this year. If you wish to retain the previous charts, you can set RevealSdkSettings.EnableNewCharts = false.
- Updated Bar and Column Charts: A new Overlap and Gap property in the visualization editor Settings pane allows you to control the amount of overlap between the bars and columns, and the amount of space between the groups. This new setting lets you ‘merge’ bars and columns, giving you new ways to visualize data and data labels.
- Treemap Visualization Tooltip: We continue to improve the tooltip experience in Reveal. With this release, you now get a tooltip on hover with highlights on the node when the mouse is hovering.
- Data Sources Dialog Filter: In the Node server, we added a new dataSourceItemFilter property to the RevealOptions. This mimics the IRVObjectFilterin the .NET Core server which allows the filtering of data sources items in the data source dialog. This feature levels up your ability to set server-side security, determining on which data objects a user is allowed to see the client on.
Bug Fixes
We’ve also addressed several bugs to ensure a smoother and more reliable analytics experience across all platforms, including fixes for Pie charts, Grid crashes, data blending errors, and more. Here is a complete list:
-
Pie & Doughnut charts are not displayed when exporting from UI.
-
Deleting a data blend while a calculated field depends on it won’t delete the calculated field.
-
Calling a function in Redshift & Postgres could produce an error message.
-
RevealView positioning and sizing when using transform:scale style on the container or any ancestor element.
-
Setting canAddDateFilter caused exceptions.
-
Save event args.isNew is false if dashboard property is set to null or undefined.
-
Stored procedures parameter screen will sometimes pull previous data or nothing at all.
-
Scroll stops working on pop-up element when using search bar.
-
Scatter Map indicators hover region shifts with zoom.
-
Fraction digits are not shown in Choropleth Map tooltip.
-
Filter value above 3000+ is not preserved.
-
Errors with renamed pivot fields in post-calculated field UI.
-
Preview data cell is not being reused causing it to be rendered multiple times.
-
Grids crash on MacOS ARM64.
-
Pie Chart legend disappears when there is enough space to show it.
-
Hover event not behaving as intended on slice charts.
-
Grand Totals are not shown in the Pivot Grid visualizations.
-
Incorrect grand totals values shown when using Analysis Services data provider.
-
Dashboard and visualization filters with wrong grand totals when using Analysis Services data provider.
-
Field name modifications lost after reordering values on Pivot Grid.
-
Error “…hierarchy already appears in the Axis1 axis.” in Analysis Services.
-
Wrong results when applying ‘Top N’ filter in Analysis Services.
-
Resource based visualization fetches wrong cache entry.
-
Wrong cache entry is hit when using blending.
-
Can’t set focus to search box after the browser goes to background.
Dependency Updates
- Playwright v1.27.2 dependency updated to v1.42.0.