Scriptly Helps Pharmacies Identify Trends in Real Time with Reveal

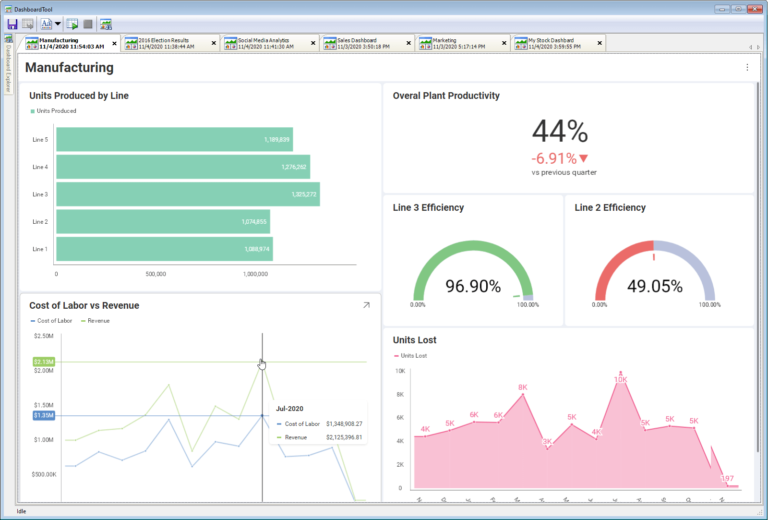
When large government agencies, banks, manufacturers and retail companies need to access big data stored in Teradata or other data warehouses, many turn to Atanasoft. The company’s comprehensive product suites include tools and wizards that make it simpler and more efficient for consultants, IT management and general users to access and use data from large data warehouses. For example, a manufacturer can see at a glance the efficiencies of multiple production lines, the plant’s overall productivity, and the cost of labor vs revenue.
Atanasoft’s two main product lines are DataGEM for Open Database Connectivity (ODBC)-based databases and AtanaSuite for ODBC and Teradata warehouses. AtanaSuite is the only commercially available productivity suite that accesses Teradata warehouses in native mode.
“Imagine almost any retail store you visit,” says Jim Richardson, president of Atanasoft. “When your products are scanned at the cash register, all that scanned data goes to a data warehouse somewhere. And in that data warehouse, it’s 100% certain that they’re using an application like AtanaSuite or DataGEM to manage and analyze all that data to make better business decisions.”
Atanasoft has always been at the leading edge for data analysis and visualizations and has relied upon Infragistics for its libraries of reliable, high-performance components.
Infragistics ensures its components and controls include the most advanced technology by continually assessing market changes and updating their components. Reveal is Infragistics most advanced embedded analytics and visualization product and is leading the new wave of embedded analytics software that lets users see data points in beautiful pictures for faster comprehension.
“We wanted to add a true visualization capability as an addition to the charting capability. We were looking to make a transformation from the comprehensive data retrieval and analysis capabilities within AtanaSuite and DataGEM to dynamic information presented as user-defined dashboards.”
To provide these visualizations and dashboards within its software, Atanasoft chose to embed Reveal into both AtanaSuite and DataGEM. Embedded analytics software delivers real-time reporting, interactive data visualization and/or advanced analytics, including machine learning, directly into an enterprise business application.
Atanasoft selected Reveal for several reasons, including the long-term relationship with Infragistics. “We’ve developed a high level of trust over 20 years with Infragistics and we know they have a customizable product that meets our needs,” adds Richardson.
Atanasoft also likes the visual beauty of Reveal and how easy it is for customers to use. They also trust the stability and flexibility of Reveal’s architecture and the quality of its components. “We recognized the Reveal .NET architecture as being state of the art and compatible with AtanaSuite and DataGEM,” adds Richardson.
“Our product suites are modular, yet integrated,” says Richardson. “All of our tools, helpers and wizards provide unique, powerful functions — yet they all work together. It’s like your favorite toolchest in the garage, such as Snap-On or Craftsman.”
The module in the Atanasoft products that is based on the Reveal SDK is called the Dashboard Tool. It’s fully integrated with the same look and feel as the product’s other modules. When customers use the query tool and attach it to a Teradata or Oracle database and pull data from a DB2 or SQL server, AtanaSuite and DataGEM capture the data and display it using the Reveal controls.
This is the magic. On the fly, we transform data from disparate data sources into visual displays that the brain can understand and act on.
Jim Richardson, president of Atanasoft
What’s unique about the combination of the Atanasoft technology and Reveal controls is that Atanasoft’s Qset technology converts and normalizes data from multiple databases and then can display the disparate data on each separate Reveal control on a dashboard. This allows Atanasoft customers, from manufacturers to banks to local and state governments, to see in one visual display separate controls and each showing relevant, urgent data from a different source.
“This is the magic,” says Richardson. “On the fly, we transform data from disparate data sources into visual displays that the brain can understand and act on. It’s why visualizations are so powerful. They integrate all the data in one beautiful dashboard — and our customers love it.”

Reveal lets Atanasoft customers self-serve with powerful, but simple-to-use features including:
“Customers love the dashboards because it’s their canvas — they create moving pictures or visualizations that their audience will understand and appreciate,” adds Richardson.
Atanasoft’s customers also like that they can see data in context — at the exact moment when they are querying databases and looking for insights. No need to leave AtanaSuite or DataGEM, run a separate analytics program, then come back.
“This is what makes data analytics impactful,” says Richardson. “The dashboards are within our products, so they get seen; they are there at the moment the customer needs the information. So they can get insights, and make decisions. Ultimately that’s the power we’ve now built into our database software tools.”
Back to Top