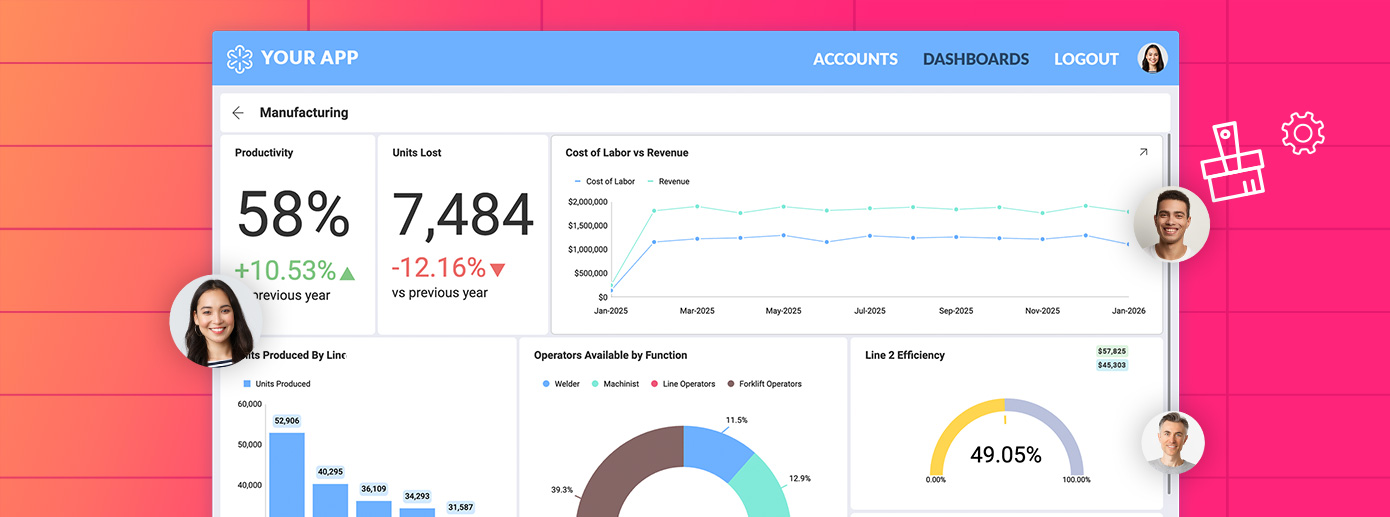
We are thrilled today to announce another big update for our Reveal product! This release is packed with features that touch on today’s hottest topics and trends:
- Predictive and Advanced Analytics
- Machine Learning
- R & Python Scripting
- Big Data Connectors
- Advanced Visualization Interactions
- and much more
I’ll highlight each feature in this blog, and with the screen shots you’ll get an idea of what to expect the next time you log in to Reveal!
Also note that we’ve moved Reveal to a Linux cloud backend, offering you a much lower-cost deployment option than Windows while also including support for .NET Core 3.
Advanced Analytics with Statistical Functions
In just a few clicks, you as a business user can quickly gain more insights about your data and perform a variety of statistical analytics using any of the following built in functions:
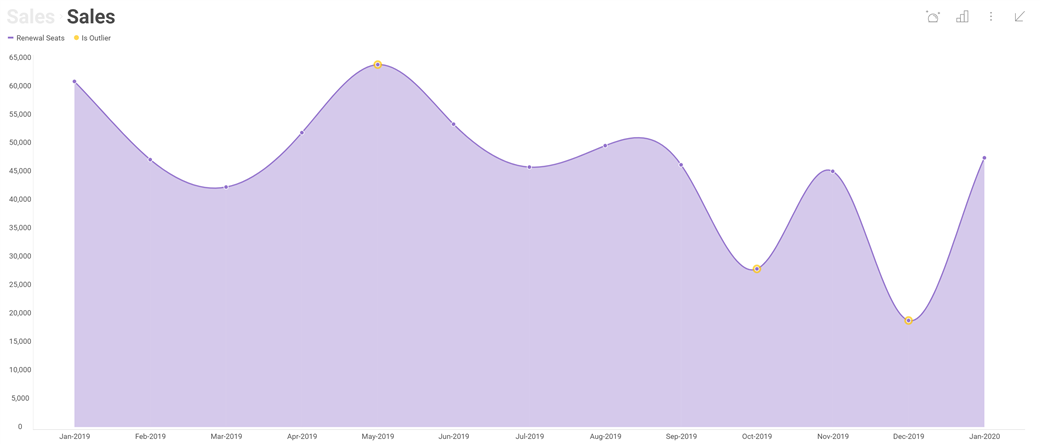
Outliers Detection
With Outliers Detection, easily detect points in your data that are anomalies and differ from much of your data set. You can show or hide these outliers from view, so they’re always showing or so they don’t interfere with your analysis.
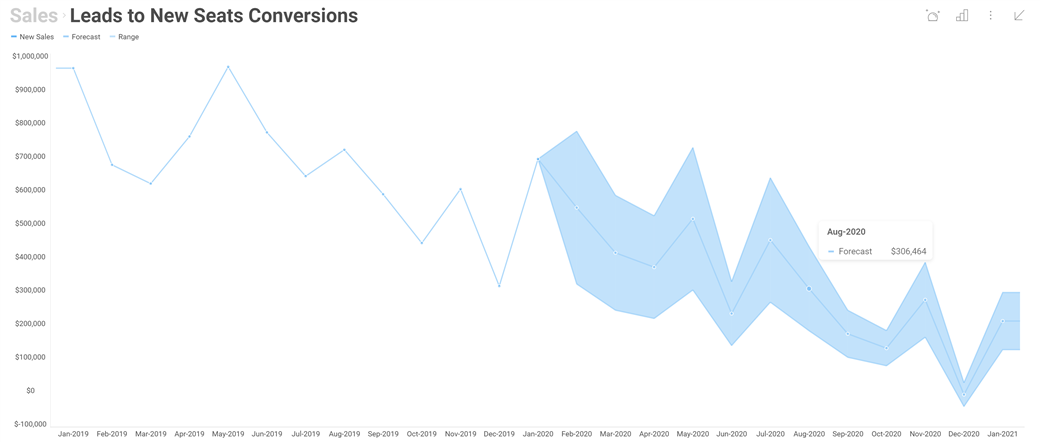
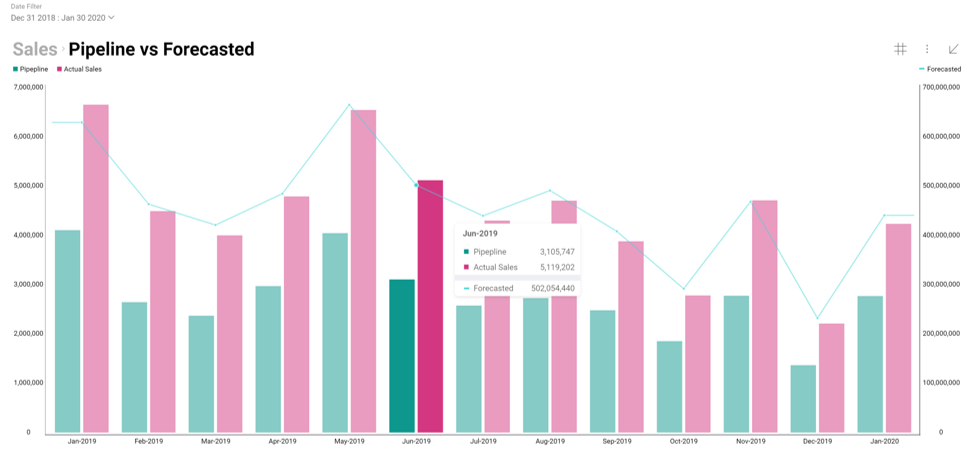
Time Series Forecasting
With Time Series Forecasting, Reveal will make predictions on future values based on historical data and trends. This is useful in any number of applications, such as sales and revenue forecasting, inventory management, and many others.
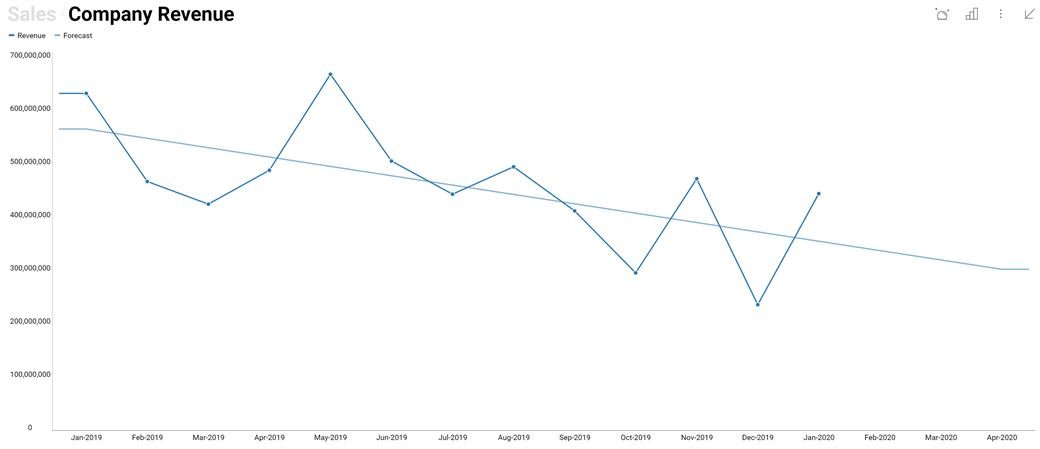
Linear Regression
With Linear Regression, you’ll be able to visually see trends in your data by finding the relationship between two variables and see a linear approximation of your data – including future trends. Along with Linear Regression, Reveal includes these algorithms trend lines: Linear Fit, Quadratic Fit, Cubic Fit, Quartic Fit, Logarithmic Fit, Exponential Fit, Power Law Fit, Simple Average, Exponential Average, Modified Average, Cumulative Average, and Weighted Average.
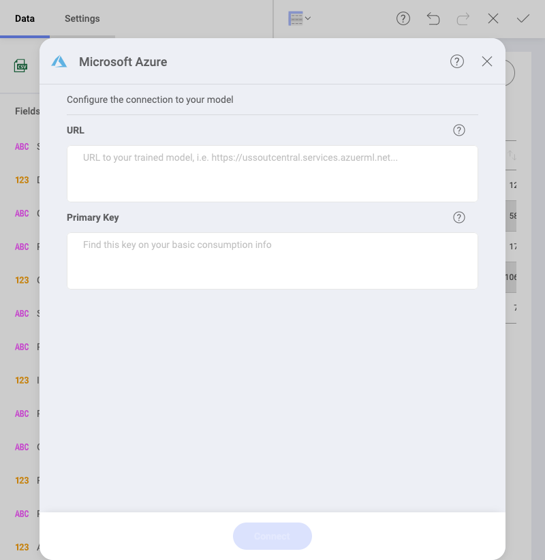
Machine Learning
You can now bring the power of Machine Learning into Reveal! Microsoft Azure Machine Learning Models Integration allows you to use trained models applied to your data from Azure Machine Learning Studio to build beautiful visualizations. Simply point your data to the URL of your Azure model and Reveal will render a visualization based on your machine learning scenario. You can also used trained models applied to your data from Google BigQuery Platforms to build striking visualizations.
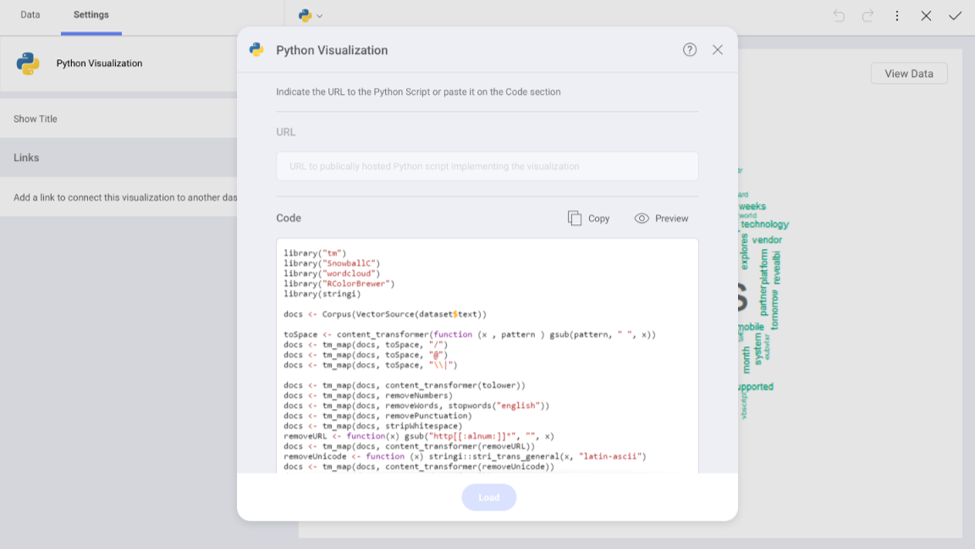
R & Python Scripting
We now support R and Python scripting, which is the on-ramp for your inner Citizen Data Scientist to perform statistical analysis and data analytics that pushes the limits of what Reveal can do with your data set. For example, you can pre-/post-process data to improve your visualization output or render unique visualizations that are included in R or Python libraries. Simply paste a URL to your scripts or paste your code into the script editor.
Hot New Data Source Connectors!
By popular demand, we’ve added 3 important new data connectors to Reveal:
- Azure SQL
- Azure Synapse
- Google Big Query
With these powerful new connectors, you can pull in millions of records into Reveal and create visualizations without sacrificing speed! We’ve tested 100 million records in Azure Synapse … and it loads in a snap!
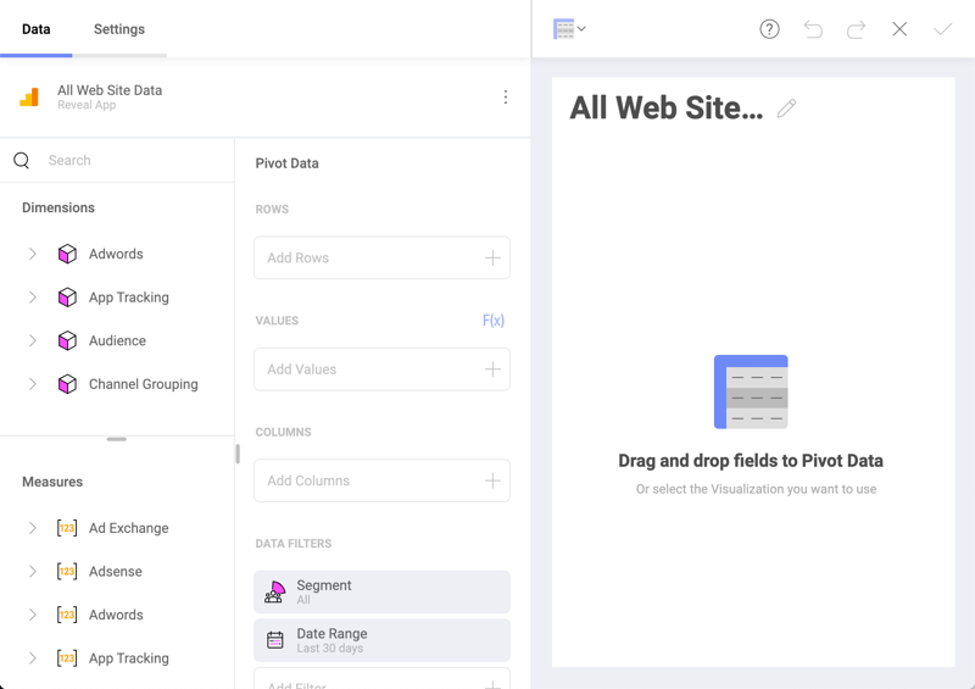
For the Marketing, Sales & IT needs, we’ve added new connectors for:
- Google Analytics
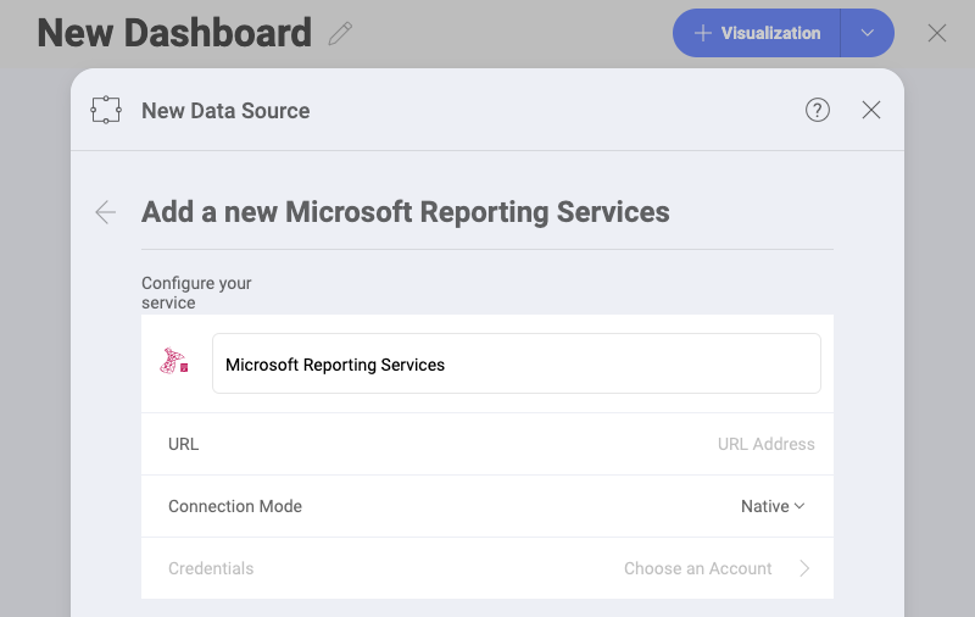
- Microsoft SQL Server Reporting Services (SSRS)
- Salesforce
With Google Analytics, one of the most used web analytics services on the market, you can build dashboards that bring insights from your website traffic, usage from your applications and much more! With Reporting Services, you can render a PDF visualization as a Reveal Visualization or use the fields in your report to craft new visualizations that Reporting Services does not offer. This is perfect for legacy uses – just point your SSRS URL at Reveal and breathe new, interactive life into your data.
New Visualization Level Interactions
We’ve made data analysis and visualization even better in this release. To hone-in on the data that’s most important, Reveal now includes:
- Hover ToolTips with sleeker style and better readability
- Crosshair support for your charts for better precision on the points in your visualizations!
- Value Overlays that give precision indicators on the X & Y axis based on the data point hover location
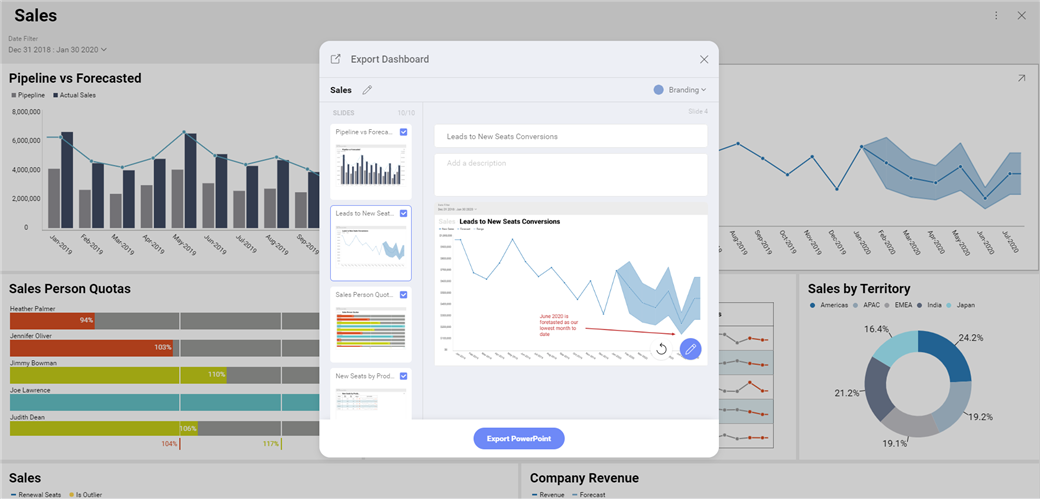
Advanced Exporting Options
In addition to adding a PDF export you now have the power to completely customize the exporting functionality when exporting to PowerPoint and PDF. With this release, you can:
- Pick which visualizations you want included in your export
- Add titles to your slides and pages
- Annotate your visualizations
- Add custom branding to match your company’s logo, name and colors
New Themes to Match Your****App’s Look and Feel
The latest Reveal version includes two new themesthat work inlightand dark mode. Customize themto match your app’s look and feel when embedding Reveal into yourapplicationand have completecontrolovercolors, fonts, shapes and more!