Scriptly Helps Pharmacies Identify Trends in Real Time with Reveal
Explore the complete guide to embedded analytics, including architecture, security, AI capabilities, implementation patterns, and evaluation criteria for modern applications.
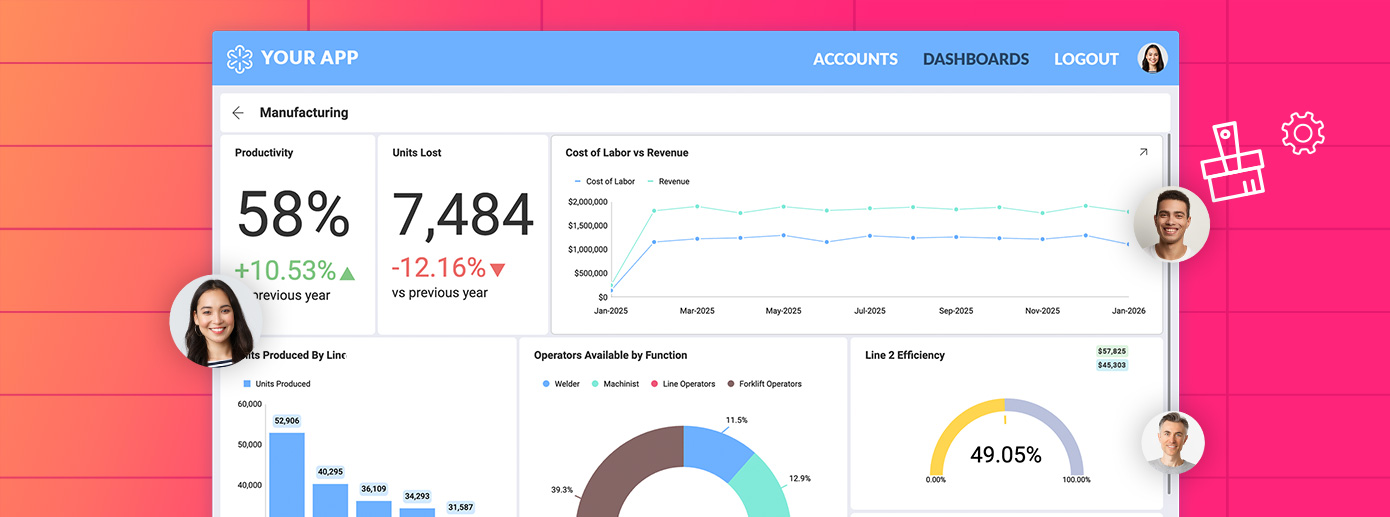
Read NowFully branded white label dashboards offer custom personalization so that your customers can present a holistic service that is all branded to one company.
Read Now¿Tiene problemas con la adopción de paneles? Aprenda por qué los usuarios ignoran los paneles y cómo la analítica integrada impulsa el uso real y mejores decisiones.
Executive Summary:
Los equipos de producto rara vez tienen problemas para construir paneles.
Tienen problemas para que alguien los use realmente.
Envías analítica. Los datos son precisos. Las visualizaciones se ven bien.
Pero una semana después, el uso disminuye y tus paneles se convierten silenciosamente en un adorno.
Esto no es un problema de herramientas. Es un problema de uso. Un problema de adopción de paneles.
La mayoría de los paneles están diseñados para informes, no para la toma de decisiones. Viven en una pestaña separada y requieren que los usuarios dejen lo que están haciendo.
Y asumen que los usuarios saben cuándo y por qué revisarlos.
Pero así no trabajan las personas.
Los usuarios no se despiertan pensando:
“Voy a revisar un panel.”
Actúan cuando algo en su flujo de trabajo lo requiere. Si la analítica no es parte de ese flujo de trabajo, no se utiliza.
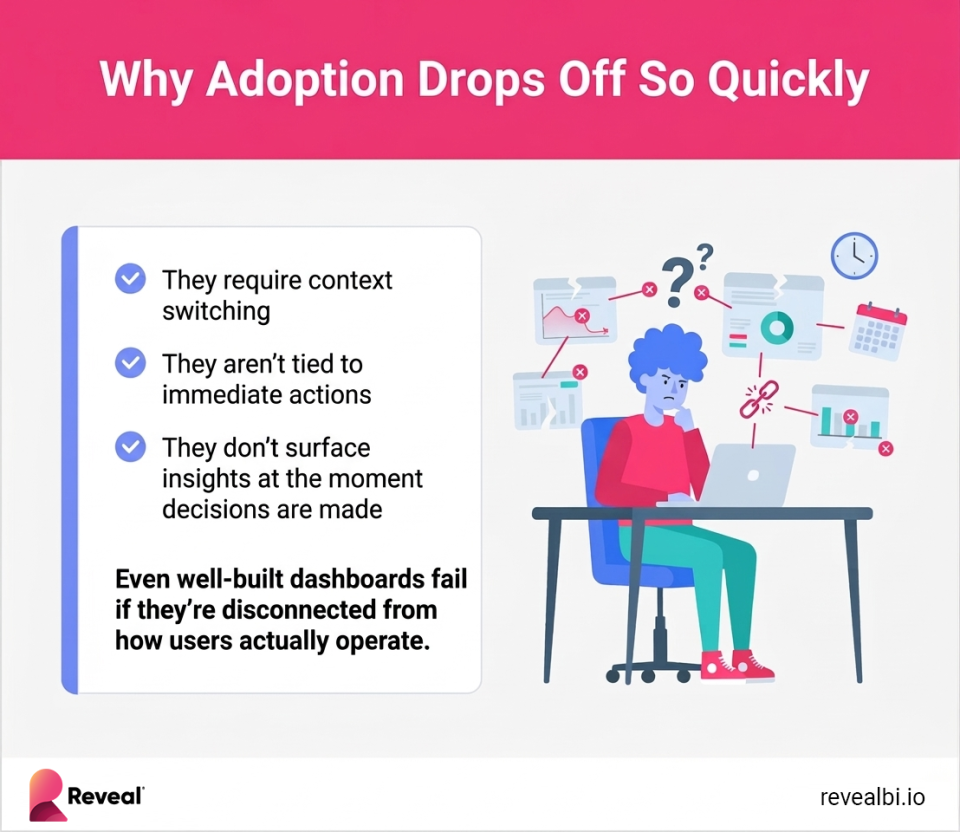
En todos los equipos de producto, el patrón es consistente:
¿Por qué?
Porque los paneles introducen fricción:
Incluso los paneles bien construidos fallan si están desconectados de cómo operan realmente los usuarios.
Los productos que ven un uso real de analítica no tratan los paneles como destinos.
Tratan la analítica como parte de la experiencia del producto.
Eso significa:
Este es el cambio de: “Aquí están sus datos”
a “Aquí está lo que debería hacer a continuación”
Si su objetivo es la adopción, la pregunta no es:
“¿Tenemos paneles?”
Es:
“¿Nuestros usuarios están usando datos realmente para tomar decisiones?”
Eso requiere repensar cómo se entrega la analítica:
Este cambio es cada vez más importante a medida que los equipos incorporan IA en la analítica.
Porque la IA no arregla los paneles sin usar, amplifica el problema si el uso no está ahí para empezar.
Si los usuarios no interactúan con sus datos hoy, añadir IA no cambiará eso.
Pero integrar la información en los flujos de trabajo sí lo hará.
Diseña Analítica que los Usuarios Realmente Usan
Únete a nuestro seminario web para aprender a integrar la analítica en los flujos de trabajo e impulsar una adopción real.